
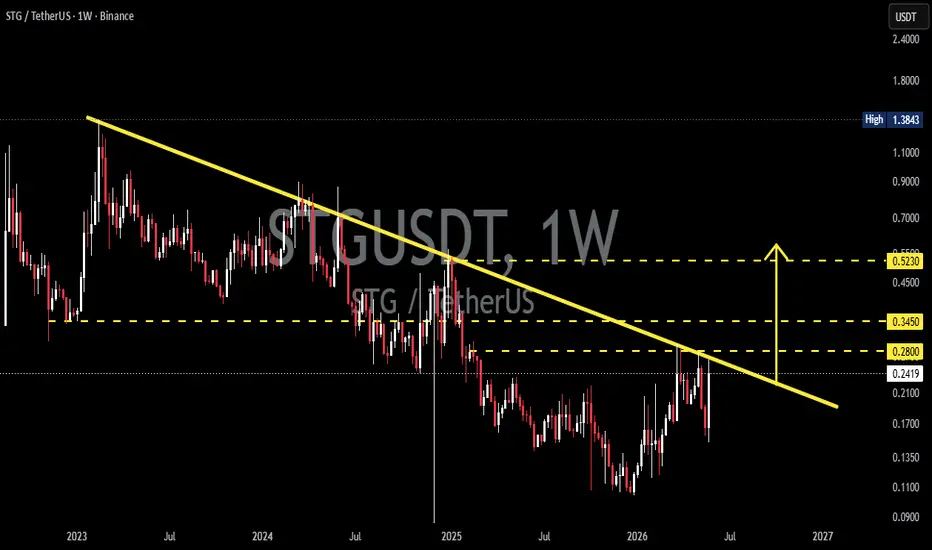
On the 1W (Weekly) timeframe, STG/USDT is still trading below a long-term Descending Trendline that has been suppressing price action since the 2023 peak. 📉 This trendline acts as a dynamic resistance, continuously creating Lower Highs (LH) and maintaining a bearish market structure over the long term.
However, the chart is beginning to show signs of recovery after forming a stronger base in the lower price region. 🔄 STG is currently testing a key resistance zone that coincides with the descending trendline.
⚠️ As long as price remains below the trendline and fails to secure a weekly close above it, the broader structure should still be considered Bearish-to-Neutral.
---
📉 Pattern Formation: Descending Trendline
🔍 Pattern Characteristics
✅ A declining resistance line connecting multiple significant swing highs.
✅ Reflects long-term seller dominance.
✅ The more times resistance is tested, the greater the probability of a breakout.
✅ A valid breakout is typically confirmed by increased volume and a weekly close above the trendline.
📌 On this chart, price has gradually returned to test the trendline after an extended accumulation phase, making the current area a crucial decision point for the next major trend direction.
---
🟢 Bullish Scenario
📈 Bullish Confirmation Requirements
✔️ Price successfully breaks above the Descending Trendline.
✔️ Weekly candle closes above trendline resistance.
✔️ A successful retest establishes new support.
If the breakout is confirmed, the potential upside targets are:
🎯 Target 1: $0.2800
🎯 Target 2: $0.3450
🎯 Target 3: $0.5230
🚀 The $0.5230 level represents a major resistance zone and serves as the primary long-term technical target following a breakout.
💡 If the broader cryptocurrency market maintains positive momentum, STG could enter a significant trend reversal phase after spending more than two years under bearish pressure.
---
🔴 Bearish Scenario
⚠️ Risks to Watch
❌ Price fails to break above the trendline.
❌ Strong rejection occurs at the current resistance zone.
❌ Weekly close falls back below nearby support levels.
If this scenario unfolds, selling pressure may regain control and push price back toward lower support zones.
📉 First Support: Around $0.1700
📉 Next Support: Around $0.1350
📉 Major Demand Zone: Around $0.1100
⚠️ As long as price remains below the Descending Trendline, the possibility of further rejection should not be ignored.
---
🔍 Conclusion
STG/USDT is currently at a critical stage after months of trading within a long-term bearish structure. 📊 The Descending Trendline that has constrained price action since 2023 is now being tested again, making this area a key decision point for the next major market move.
🟢 Bullish Scenario
📌 A breakout and weekly close above the trendline could open the door toward $0.2800, $0.3450, and eventually $0.5230.
🔴 Bearish Scenario
📌 Failure to break resistance could trigger renewed selling pressure and a move back toward lower support zones.
💎 Traders should wait for a confirmed breakout before anticipating a long-term trend reversal.
#STG #STGUSDT #StargateFinance #Crypto #Cryptocurrency #Altcoin #TechnicalAnalysis #TradingView #PriceAction #ChartAnalysis #Bullish #Bearish #Breakout #Trendline #DescendingTrendline #WeeklyChart #CryptoTrading #AltcoinSeason #SupportAndResistance #MarketAnalysis
However, the chart is beginning to show signs of recovery after forming a stronger base in the lower price region. 🔄 STG is currently testing a key resistance zone that coincides with the descending trendline.
⚠️ As long as price remains below the trendline and fails to secure a weekly close above it, the broader structure should still be considered Bearish-to-Neutral.
---
📉 Pattern Formation: Descending Trendline
🔍 Pattern Characteristics
✅ A declining resistance line connecting multiple significant swing highs.
✅ Reflects long-term seller dominance.
✅ The more times resistance is tested, the greater the probability of a breakout.
✅ A valid breakout is typically confirmed by increased volume and a weekly close above the trendline.
📌 On this chart, price has gradually returned to test the trendline after an extended accumulation phase, making the current area a crucial decision point for the next major trend direction.
---
🟢 Bullish Scenario
📈 Bullish Confirmation Requirements
✔️ Price successfully breaks above the Descending Trendline.
✔️ Weekly candle closes above trendline resistance.
✔️ A successful retest establishes new support.
If the breakout is confirmed, the potential upside targets are:
🎯 Target 1: $0.2800
🎯 Target 2: $0.3450
🎯 Target 3: $0.5230
🚀 The $0.5230 level represents a major resistance zone and serves as the primary long-term technical target following a breakout.
💡 If the broader cryptocurrency market maintains positive momentum, STG could enter a significant trend reversal phase after spending more than two years under bearish pressure.
---
🔴 Bearish Scenario
⚠️ Risks to Watch
❌ Price fails to break above the trendline.
❌ Strong rejection occurs at the current resistance zone.
❌ Weekly close falls back below nearby support levels.
If this scenario unfolds, selling pressure may regain control and push price back toward lower support zones.
📉 First Support: Around $0.1700
📉 Next Support: Around $0.1350
📉 Major Demand Zone: Around $0.1100
⚠️ As long as price remains below the Descending Trendline, the possibility of further rejection should not be ignored.
---
🔍 Conclusion
STG/USDT is currently at a critical stage after months of trading within a long-term bearish structure. 📊 The Descending Trendline that has constrained price action since 2023 is now being tested again, making this area a key decision point for the next major market move.
🟢 Bullish Scenario
📌 A breakout and weekly close above the trendline could open the door toward $0.2800, $0.3450, and eventually $0.5230.
🔴 Bearish Scenario
📌 Failure to break resistance could trigger renewed selling pressure and a move back toward lower support zones.
💎 Traders should wait for a confirmed breakout before anticipating a long-term trend reversal.
#STG #STGUSDT #StargateFinance #Crypto #Cryptocurrency #Altcoin #TechnicalAnalysis #TradingView #PriceAction #ChartAnalysis #Bullish #Bearish #Breakout #Trendline #DescendingTrendline #WeeklyChart #CryptoTrading #AltcoinSeason #SupportAndResistance #MarketAnalysis

✅ Get Free Signals! Join Our Telegram Channel Here: t.me/TheCryptoNuclear
✅ Twitter: twitter.com/crypto_nuclear
✅ Join Bybit : partner.bybit.com/b/nuclearvip
✅ Benefits : Lifetime Trading Fee Discount -50%
✅ Twitter: twitter.com/crypto_nuclear
✅ Join Bybit : partner.bybit.com/b/nuclearvip
✅ Benefits : Lifetime Trading Fee Discount -50%
Exención de responsabilidad
La información y las publicaciones no constituyen, ni deben considerarse como, asesoramiento o recomendaciones financieras, de inversión, de trading u otro tipo, proporcionadas o respaldadas por TradingView. Obtenga más información en Condiciones de uso.
✅ Get Free Signals! Join Our Telegram Channel Here: t.me/TheCryptoNuclear
✅ Twitter: twitter.com/crypto_nuclear
✅ Join Bybit : partner.bybit.com/b/nuclearvip
✅ Benefits : Lifetime Trading Fee Discount -50%
✅ Twitter: twitter.com/crypto_nuclear
✅ Join Bybit : partner.bybit.com/b/nuclearvip
✅ Benefits : Lifetime Trading Fee Discount -50%
Exención de responsabilidad
La información y las publicaciones no constituyen, ni deben considerarse como, asesoramiento o recomendaciones financieras, de inversión, de trading u otro tipo, proporcionadas o respaldadas por TradingView. Obtenga más información en Condiciones de uso.