
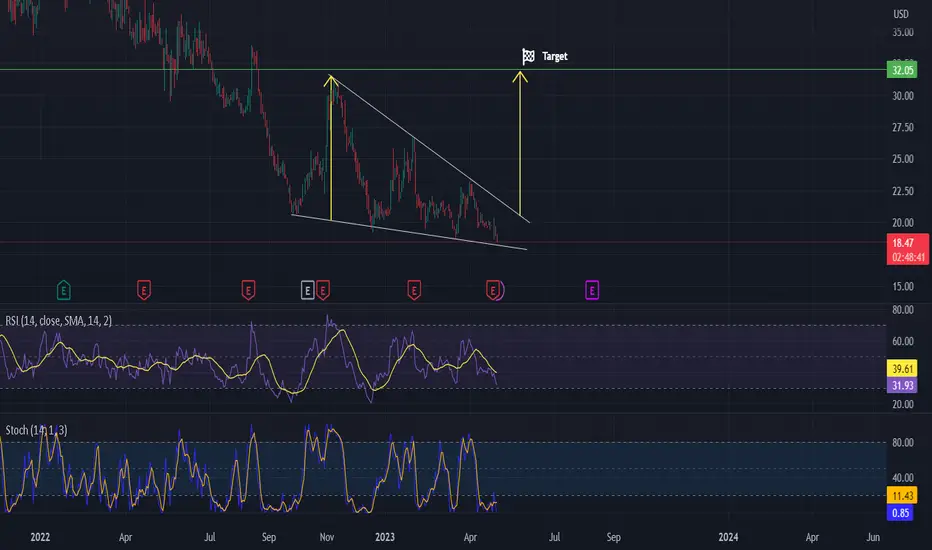
On this chart we can see a falling wedge pattern.
The RSI and Stochastics are both showing signs of oversold conditions.
Enter the long position once the price breaks out of the pattern.
Target is shown on the chart.
The RSI and Stochastics are both showing signs of oversold conditions.
Enter the long position once the price breaks out of the pattern.
Target is shown on the chart.

💥 Free signals and ideas ➡ t.me/vfinvestment
Exención de responsabilidad
La información y las publicaciones no constituyen, ni deben considerarse como, asesoramiento o recomendaciones financieras, de inversión, de trading u otro tipo, proporcionadas o respaldadas por TradingView. Obtenga más información en Condiciones de uso.