SUNTV1!
27-11
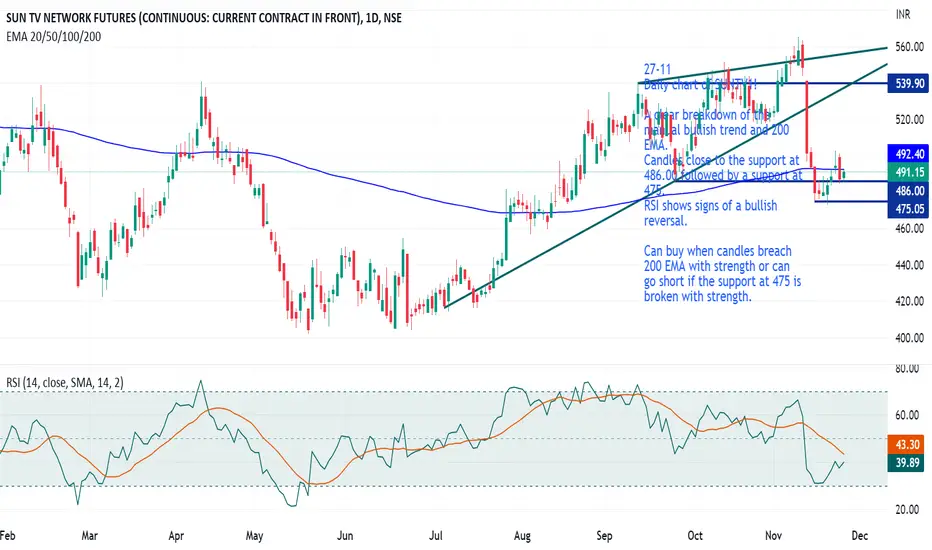
Daily chart of SUNTV1!
A clear breakdown of the manual bullish trend and 200 EMA.
Candles close to the support at 486.00 followed by a support at 475.
RSI shows signs of a bullish reversal.
Can buy when candles breach 200 EMA with strength or can go short if the support at 475 is broken with strength.
Daily chart of SUNTV1!
A clear breakdown of the manual bullish trend and 200 EMA.
Candles close to the support at 486.00 followed by a support at 475.
RSI shows signs of a bullish reversal.
Can buy when candles breach 200 EMA with strength or can go short if the support at 475 is broken with strength.

Exención de responsabilidad
La información y las publicaciones no constituyen, ni deben considerarse como, asesoramiento o recomendaciones financieras, de inversión, de trading u otro tipo, proporcionadas o respaldadas por TradingView. Obtenga más información en Condiciones de uso.
Exención de responsabilidad
La información y las publicaciones no constituyen, ni deben considerarse como, asesoramiento o recomendaciones financieras, de inversión, de trading u otro tipo, proporcionadas o respaldadas por TradingView. Obtenga más información en Condiciones de uso.