
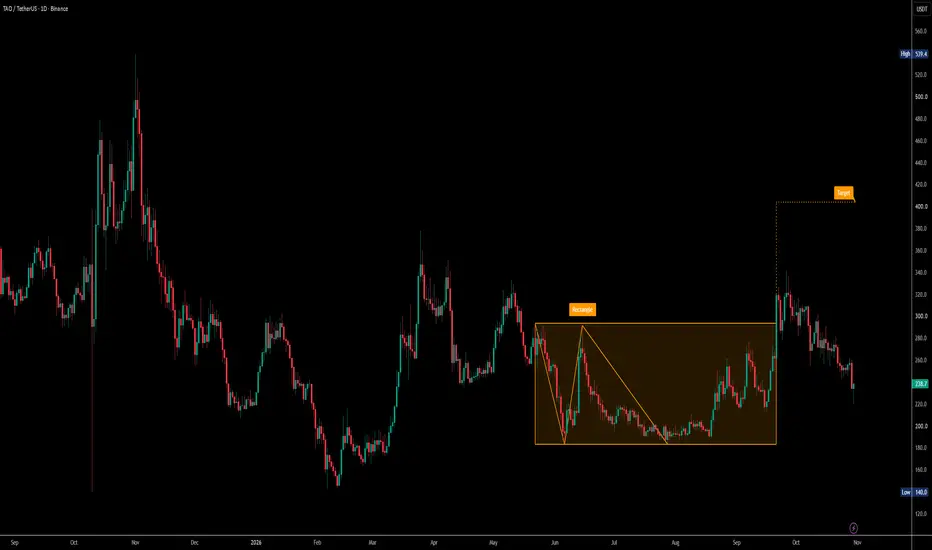
TAOUSDT | 1D Timeframe | Binance
TAOUSDT is trading near $238.30, showing a corrective movement following a breakout from a multi-month rectangle consolidation pattern.
The daily chart highlights a rectangle formation between approximately $185 and $293, extending from late May through September.
Price previously broke above the upper boundary near $293, rallied toward $340, and subsequently entered a correction.
The current decline has taken price back inside the former consolidation range, suggesting that the earlier bullish breakout has lost momentum.
Key Resistance Levels:
- $260–$280 – Immediate resistance region
- $290–$295 – Rectangle breakout boundary
- $320–$340 – Previous rally resistance
Key Support Levels:
- $230–$240 – Immediate support region
- $200–$210 – Intermediate support
- $180–$190 – Rectangle lower boundary
Bullish Scenario:
A sustained daily close above $293–$295 could indicate a recovery above the rectangle resistance.
If confirmed, price could revisit $320–$340, with the chart's projected upside target near $405.
The projected move from the $293 breakout level to $405 represents approximately 38.2% upside.
Bearish Scenario:
Failure to hold $230 could expose the $200–$210 region.
A sustained breakdown below $180–$190 would weaken the rectangle's longer-term support structure and invalidate the proposed bullish continuation scenario.
Confirmation Level:
A daily close above $295, preferably followed by a successful retest of that level as support, would provide stronger evidence for the bullish setup.
Conclusion:
TAOUSDT previously broke above its multi-month rectangle consolidation but has since fallen back into the range.
The $293–$295 resistance zone remains the primary bullish confirmation level, while $230 is the immediate support to monitor.
Watch for confirmation before interpreting the projected $405 target as an active bullish continuation.
TAOUSDT is trading near $238.30, showing a corrective movement following a breakout from a multi-month rectangle consolidation pattern.
The daily chart highlights a rectangle formation between approximately $185 and $293, extending from late May through September.
Price previously broke above the upper boundary near $293, rallied toward $340, and subsequently entered a correction.
The current decline has taken price back inside the former consolidation range, suggesting that the earlier bullish breakout has lost momentum.
Key Resistance Levels:
- $260–$280 – Immediate resistance region
- $290–$295 – Rectangle breakout boundary
- $320–$340 – Previous rally resistance
Key Support Levels:
- $230–$240 – Immediate support region
- $200–$210 – Intermediate support
- $180–$190 – Rectangle lower boundary
Bullish Scenario:
A sustained daily close above $293–$295 could indicate a recovery above the rectangle resistance.
If confirmed, price could revisit $320–$340, with the chart's projected upside target near $405.
The projected move from the $293 breakout level to $405 represents approximately 38.2% upside.
Bearish Scenario:
Failure to hold $230 could expose the $200–$210 region.
A sustained breakdown below $180–$190 would weaken the rectangle's longer-term support structure and invalidate the proposed bullish continuation scenario.
Confirmation Level:
A daily close above $295, preferably followed by a successful retest of that level as support, would provide stronger evidence for the bullish setup.
Conclusion:
TAOUSDT previously broke above its multi-month rectangle consolidation but has since fallen back into the range.
The $293–$295 resistance zone remains the primary bullish confirmation level, while $230 is the immediate support to monitor.
Watch for confirmation before interpreting the projected $405 target as an active bullish continuation.

Twitter: x.com/crypto_vulture1
📊 TA & strategies
Telegram: t.me/crypto_vulture_signals
📊 TA & strategies
Telegram: t.me/crypto_vulture_signals
Exención de responsabilidad
La información y las publicaciones no constituyen, ni deben considerarse como, asesoramiento o recomendaciones financieras, de inversión, de trading u otro tipo, proporcionadas o respaldadas por TradingView. Obtenga más información en Condiciones de uso.
Twitter: x.com/crypto_vulture1
📊 TA & strategies
Telegram: t.me/crypto_vulture_signals
📊 TA & strategies
Telegram: t.me/crypto_vulture_signals
Exención de responsabilidad
La información y las publicaciones no constituyen, ni deben considerarse como, asesoramiento o recomendaciones financieras, de inversión, de trading u otro tipo, proporcionadas o respaldadas por TradingView. Obtenga más información en Condiciones de uso.