
📌 Current Market Context
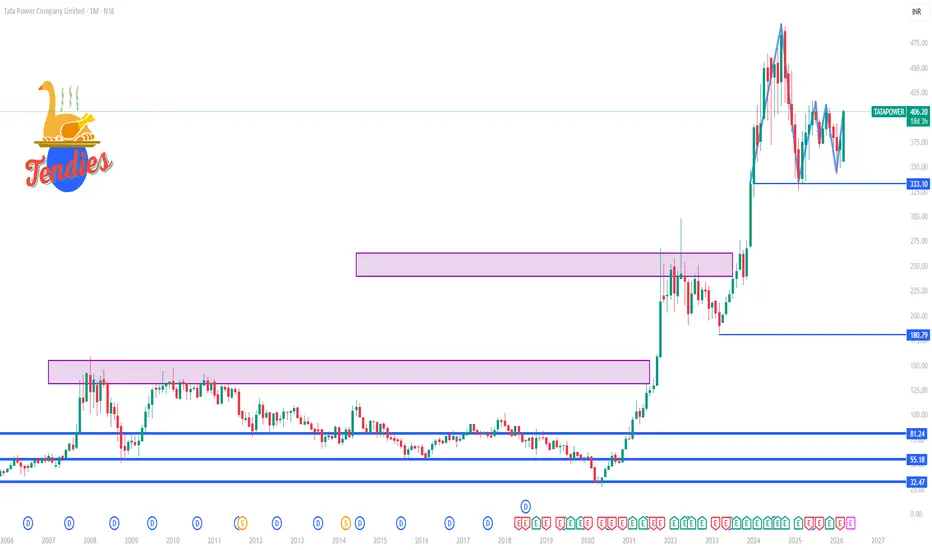
The stock is trading around ₹404 – ₹405 on NSE as of latest session.
📊 Monthly Technical Levels (1‑Month Pivot Points)
🔼 Resistance Levels (Upside Targets)
R1: ~₹392.50
R2: ~₹407.45
R3: ~₹429.50
(These are major monthly resistance zones where price may face selling pressure)
🟡 Pivot / Equilibrium Zone
Monthly Pivot Point: ~₹370.45
(Above this → bullish structure; below → bearish or consolidation)
🔽 Support Levels (Downside Zones)
S1: ~₹355.50
S2: ~₹333.45
S3: ~₹318.50
(Key support zones where buyers historically step in on dips)
📈 What This Means (Monthly Timeframe View)
📊 Bullish Scenario
If price sustains above ₹407–₹429 area, the trend can extend toward new structural highs within the 1‑month context.
RSI & long‑term averages are showing mild strength.
🤝 Neutral / Consolidation Zone
Price action between ₹370 – ₹407 indicates range‑bound behavior, suggesting traders wait for a clear breakout before bullish confirmation.
Pivot at ₹370.45 is key mid‑market reference.
📉 Bearish / Correction Zone
A clear breakdown below ₹355.50 → ₹333.45 could signal deeper correction on the monthly scale and shift momentum lower.
The stock is trading around ₹404 – ₹405 on NSE as of latest session.
📊 Monthly Technical Levels (1‑Month Pivot Points)
🔼 Resistance Levels (Upside Targets)
R1: ~₹392.50
R2: ~₹407.45
R3: ~₹429.50
(These are major monthly resistance zones where price may face selling pressure)
🟡 Pivot / Equilibrium Zone
Monthly Pivot Point: ~₹370.45
(Above this → bullish structure; below → bearish or consolidation)
🔽 Support Levels (Downside Zones)
S1: ~₹355.50
S2: ~₹333.45
S3: ~₹318.50
(Key support zones where buyers historically step in on dips)
📈 What This Means (Monthly Timeframe View)
📊 Bullish Scenario
If price sustains above ₹407–₹429 area, the trend can extend toward new structural highs within the 1‑month context.
RSI & long‑term averages are showing mild strength.
🤝 Neutral / Consolidation Zone
Price action between ₹370 – ₹407 indicates range‑bound behavior, suggesting traders wait for a clear breakout before bullish confirmation.
Pivot at ₹370.45 is key mid‑market reference.
📉 Bearish / Correction Zone
A clear breakdown below ₹355.50 → ₹333.45 could signal deeper correction on the monthly scale and shift momentum lower.

Contact Knowledgehub for a detailed consultation: Dm on WhatsApp: [wa.link/a2o0kz]-
Phone No: [+91 93102 26243]-
Email: [tradingviewknowledgehub@gmail.com]---
-- Let’s achieve success together!
Phone No: [+91 93102 26243]-
Email: [tradingviewknowledgehub@gmail.com]---
-- Let’s achieve success together!
Publicaciones relacionadas
Exención de responsabilidad
La información y las publicaciones no constituyen, ni deben considerarse como, asesoramiento o recomendaciones financieras, de inversión, de trading u otro tipo, proporcionadas o respaldadas por TradingView. Obtenga más información en Condiciones de uso.
Contact Knowledgehub for a detailed consultation: Dm on WhatsApp: [wa.link/a2o0kz]-
Phone No: [+91 93102 26243]-
Email: [tradingviewknowledgehub@gmail.com]---
-- Let’s achieve success together!
Phone No: [+91 93102 26243]-
Email: [tradingviewknowledgehub@gmail.com]---
-- Let’s achieve success together!
Publicaciones relacionadas
Exención de responsabilidad
La información y las publicaciones no constituyen, ni deben considerarse como, asesoramiento o recomendaciones financieras, de inversión, de trading u otro tipo, proporcionadas o respaldadas por TradingView. Obtenga más información en Condiciones de uso.