TCT falling wedge
#TCTBTC
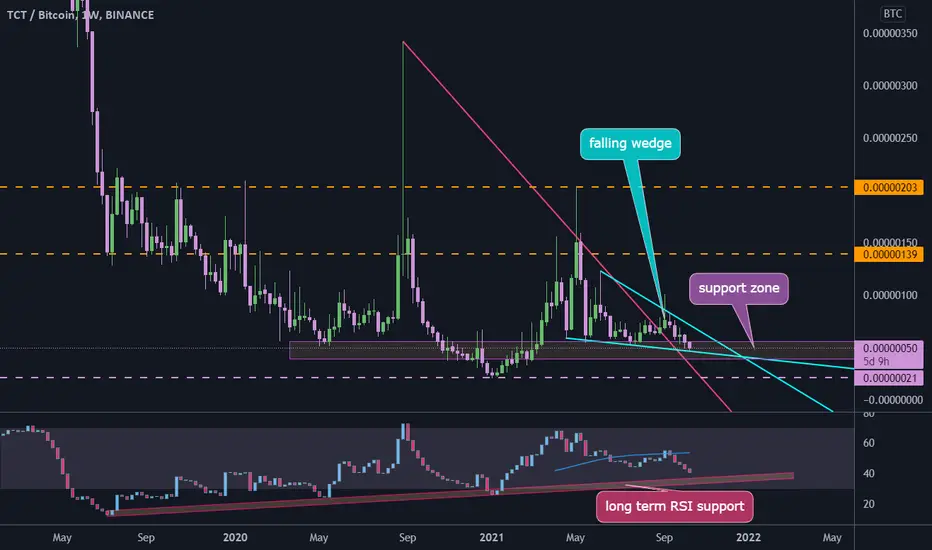
#TCT with BTC pair shows a falling wedge pattern in daily time frame, we can see that price broke out from descending resistance line and going down near this line, there is a long term support zone in RSI that shows price may fall more to touch it one more time then head up and break the wedge pattern.
#TCT with BTC pair shows a falling wedge pattern in daily time frame, we can see that price broke out from descending resistance line and going down near this line, there is a long term support zone in RSI that shows price may fall more to touch it one more time then head up and break the wedge pattern.

Exención de responsabilidad
La información y las publicaciones no constituyen, ni deben considerarse como, asesoramiento o recomendaciones financieras, de inversión, de trading u otro tipo, proporcionadas o respaldadas por TradingView. Obtenga más información en Condiciones de uso.
Exención de responsabilidad
La información y las publicaciones no constituyen, ni deben considerarse como, asesoramiento o recomendaciones financieras, de inversión, de trading u otro tipo, proporcionadas o respaldadas por TradingView. Obtenga más información en Condiciones de uso.