
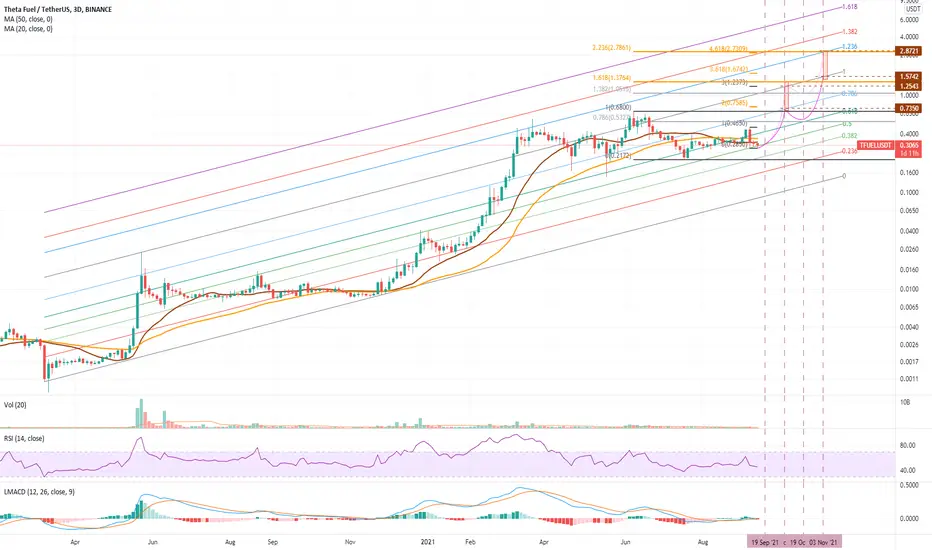
Re-running the TFUEL study in the Logarithmic scale and we see some clear and consistent structure to the market along the lines of a Fibonacci Channel.
Considering the completion of Wave 2 yesterday, this 3 Day Chart provides some insight and justification for higher targets for Wave 5.
Which do you think is more likely, the outcomes derived from previous Standard Scale chart or this Log Scale chart?
Considering the completion of Wave 2 yesterday, this 3 Day Chart provides some insight and justification for higher targets for Wave 5.
Which do you think is more likely, the outcomes derived from previous Standard Scale chart or this Log Scale chart?

Publicaciones relacionadas
Exención de responsabilidad
La información y las publicaciones no constituyen, ni deben considerarse como, asesoramiento o recomendaciones financieras, de inversión, de trading u otro tipo, proporcionadas o respaldadas por TradingView. Obtenga más información en Condiciones de uso.