
📊 Key Support & Resistance Levels
Resistance Levels:
R1: ₹3,432.14
R2: ₹3,563.29
R3: ₹3,616.93
Support Levels:
S1: ₹3,344.13
S2: ₹3,286.27
S3: ₹3,245.23
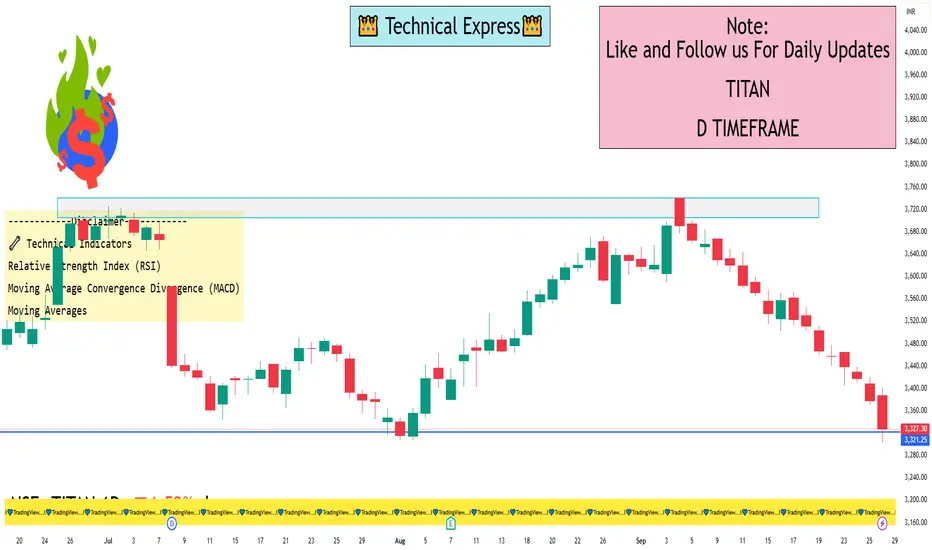
The stock is currently near its support zone, suggesting a potential for a short-term rebound if buying interest increases.
Technical Indicators
Relative Strength Index (RSI): 22.37, indicating the stock is oversold and may be due for a short-term rebound.
Moving Average Convergence Divergence (MACD): -25.28, signaling a bearish trend.
Moving Averages: A strong sell signal is observed across all major moving averages (MA5 to MA200), with 0 buy signals and 12 sell signals.
📌 Summary
Titan's stock is currently testing its support levels, with technical indicators suggesting potential for a short-term rebound. However, the overall trend remains bearish, and investors should exercise caution. Monitoring the stock's movement around the support levels will be crucial to assess the potential for a reversal.
Resistance Levels:
R1: ₹3,432.14
R2: ₹3,563.29
R3: ₹3,616.93
Support Levels:
S1: ₹3,344.13
S2: ₹3,286.27
S3: ₹3,245.23
The stock is currently near its support zone, suggesting a potential for a short-term rebound if buying interest increases.
Technical Indicators
Relative Strength Index (RSI): 22.37, indicating the stock is oversold and may be due for a short-term rebound.
Moving Average Convergence Divergence (MACD): -25.28, signaling a bearish trend.
Moving Averages: A strong sell signal is observed across all major moving averages (MA5 to MA200), with 0 buy signals and 12 sell signals.
📌 Summary
Titan's stock is currently testing its support levels, with technical indicators suggesting potential for a short-term rebound. However, the overall trend remains bearish, and investors should exercise caution. Monitoring the stock's movement around the support levels will be crucial to assess the potential for a reversal.

Publicaciones relacionadas
Exención de responsabilidad
La información y las publicaciones no constituyen, ni deben considerarse como, asesoramiento o recomendaciones financieras, de inversión, de trading u otro tipo, proporcionadas o respaldadas por TradingView. Obtenga más información en Condiciones de uso.
Publicaciones relacionadas
Exención de responsabilidad
La información y las publicaciones no constituyen, ni deben considerarse como, asesoramiento o recomendaciones financieras, de inversión, de trading u otro tipo, proporcionadas o respaldadas por TradingView. Obtenga más información en Condiciones de uso.