
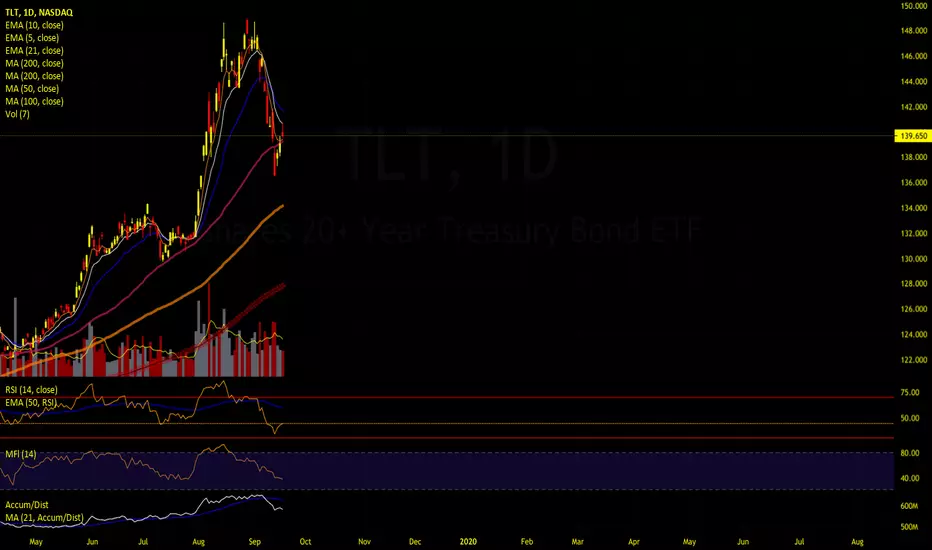
TLT price action on the daily chart showing signs of an overall long term uptrend pattern, making higher highs and higher lows. SMA50 historically acts as a "Major Support" level and is currently showing signs of a potential support there again. RSI levels recently became oversold around 33 RSI, which may greatly increase the odds of a successful trade when combine with SMA50 acting as support.
A potential entry would be end of day if the price closes above both the SMA50 and EMA10
stop set at: if price closes below SMA50 @-1.5%
Exit target set near 46.12 level @ +5%
Risk/Reward ratio good but not grear @ little above 3:1
A potential entry would be end of day if the price closes above both the SMA50 and EMA10
stop set at: if price closes below SMA50 @-1.5%
Exit target set near 46.12 level @ +5%
Risk/Reward ratio good but not grear @ little above 3:1

Exención de responsabilidad
La información y las publicaciones no constituyen, ni deben considerarse como, asesoramiento o recomendaciones financieras, de inversión, de trading u otro tipo, proporcionadas o respaldadas por TradingView. Obtenga más información en Condiciones de uso.
Exención de responsabilidad
La información y las publicaciones no constituyen, ni deben considerarse como, asesoramiento o recomendaciones financieras, de inversión, de trading u otro tipo, proporcionadas o respaldadas por TradingView. Obtenga más información en Condiciones de uso.