
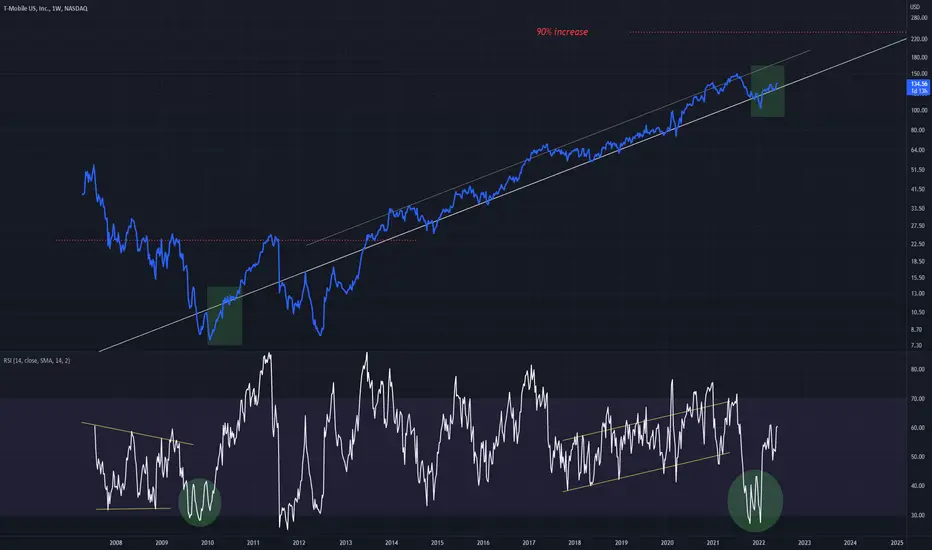
Similar structural patterns can be seen on both chart and RSI at green circle locations
In the first situation a 90% rise was seen on this Weekly chart
The second situation shows an RSI that is comparable
90% rise again?
In the first situation a 90% rise was seen on this Weekly chart
The second situation shows an RSI that is comparable
90% rise again?

Exención de responsabilidad
La información y las publicaciones no constituyen, ni deben considerarse como, asesoramiento o recomendaciones financieras, de inversión, de trading u otro tipo, proporcionadas o respaldadas por TradingView. Obtenga más información en Condiciones de uso.
Exención de responsabilidad
La información y las publicaciones no constituyen, ni deben considerarse como, asesoramiento o recomendaciones financieras, de inversión, de trading u otro tipo, proporcionadas o respaldadas por TradingView. Obtenga más información en Condiciones de uso.