Largo
TNY update.
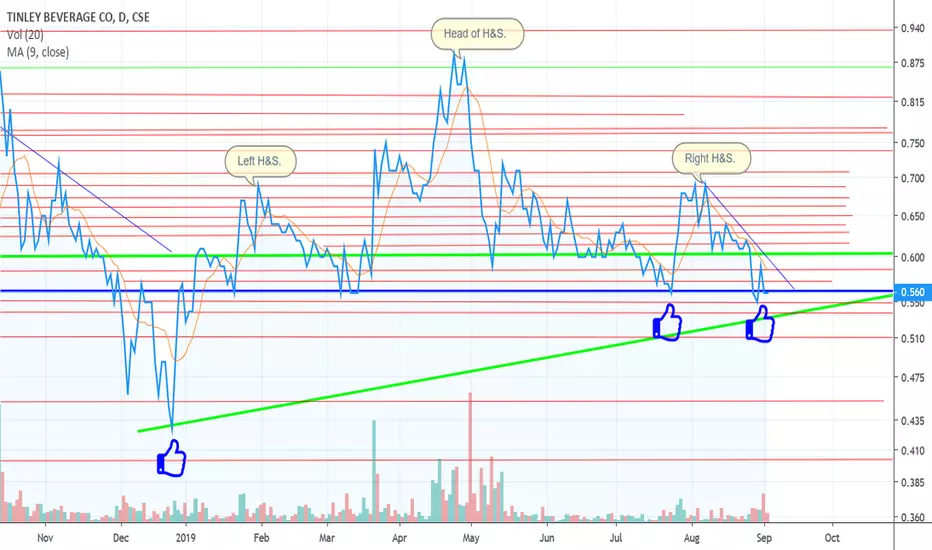
So, since the last time I posted a chart on TNY we were trading in descending triangle that broke to the downside on a "short term time frame." I had mentioned that the pattern could also be a bull flag, but that was not the case.
It is interesting however to see Tinley get back up to the 56c level where there seems to be historic support dating back to Aug 2018.
I can speculate all I want about where the share price may be in the future, but only time will tell per usual.
It is interesting however to see Tinley get back up to the 56c level where there seems to be historic support dating back to Aug 2018.
I can speculate all I want about where the share price may be in the future, but only time will tell per usual.

Publicaciones relacionadas
Exención de responsabilidad
La información y las publicaciones no constituyen, ni deben considerarse como, asesoramiento o recomendaciones financieras, de inversión, de trading u otro tipo, proporcionadas o respaldadas por TradingView. Obtenga más información en Condiciones de uso.
Publicaciones relacionadas
Exención de responsabilidad
La información y las publicaciones no constituyen, ni deben considerarse como, asesoramiento o recomendaciones financieras, de inversión, de trading u otro tipo, proporcionadas o respaldadas por TradingView. Obtenga más información en Condiciones de uso.