
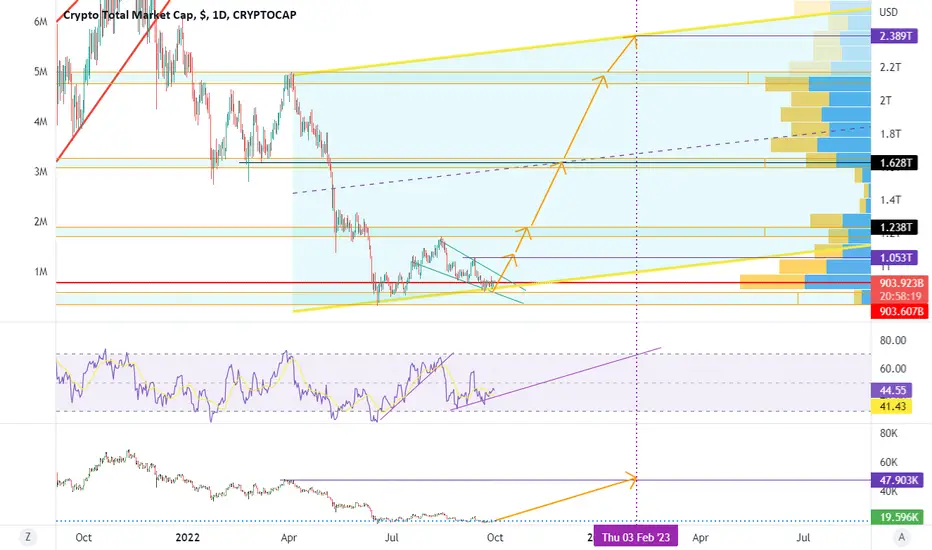
The total market cap has double bottomed on the daily reflecting a possible change in long term trend. Currently the index is within a falling wedge and will probably breakout upward.
The RSI paints heavy bullish divergence and is uptrending.
Upward break of falling wedge will raise the market cap to 1.05 trillion.
Arrows indicate possible target if bull trend is maintained.
A real double bottom will bring the index to 2 trillion, the same level as the start of April. The price of BTC at the start of April was 48.5k.
The RSI paints heavy bullish divergence and is uptrending.
Upward break of falling wedge will raise the market cap to 1.05 trillion.
Arrows indicate possible target if bull trend is maintained.
A real double bottom will bring the index to 2 trillion, the same level as the start of April. The price of BTC at the start of April was 48.5k.

Publicaciones relacionadas
Exención de responsabilidad
La información y las publicaciones no constituyen, ni deben considerarse como, asesoramiento o recomendaciones financieras, de inversión, de trading u otro tipo, proporcionadas o respaldadas por TradingView. Obtenga más información en Condiciones de uso.
Publicaciones relacionadas
Exención de responsabilidad
La información y las publicaciones no constituyen, ni deben considerarse como, asesoramiento o recomendaciones financieras, de inversión, de trading u otro tipo, proporcionadas o respaldadas por TradingView. Obtenga más información en Condiciones de uso.