
Crypto Final Bottom Projections - Using Total Marketcap
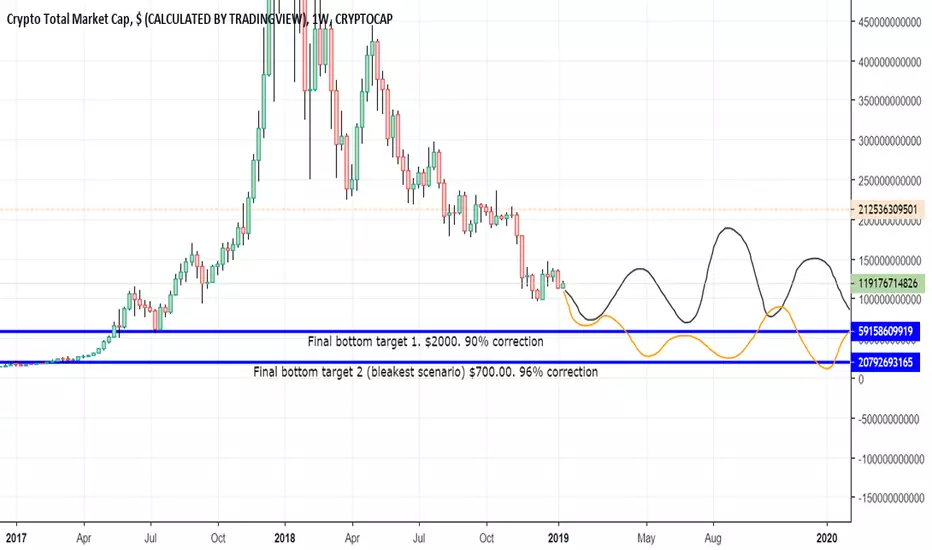
A very simple chart. Nothing fancy.
Just a projection of where the bottom will come in, based on the bubble chart (the total crypto market cap, weekly).
The chart seems to show two very clean paths to the bottom:
$2000 - this would be a point of price reaction low enough to constitute a bottom, a 90% retrace.
$700 - this is the worst case perhaps, but is in keeping with the very beginning of the 2016+ bull market. 96% retrace.
In truth the bottom will probably fall in a "range" in this area of the chart.
I expect the crypto markets to chop sideways between 2k - 6.3k for the rest of 2019.
Just a projection of where the bottom will come in, based on the bubble chart (the total crypto market cap, weekly).
The chart seems to show two very clean paths to the bottom:
$2000 - this would be a point of price reaction low enough to constitute a bottom, a 90% retrace.
$700 - this is the worst case perhaps, but is in keeping with the very beginning of the 2016+ bull market. 96% retrace.
In truth the bottom will probably fall in a "range" in this area of the chart.
I expect the crypto markets to chop sideways between 2k - 6.3k for the rest of 2019.
Nota
You got to love that I posted this chart at the EXACT BOTTOM.Had I just continued monitoring these levels, would have made major profits.
As ever, my principal weakness as a trader is greed-fuelled short term focus...

Exención de responsabilidad
La información y las publicaciones no constituyen, ni deben considerarse como, asesoramiento o recomendaciones financieras, de inversión, de trading u otro tipo, proporcionadas o respaldadas por TradingView. Obtenga más información en Condiciones de uso.
Exención de responsabilidad
La información y las publicaciones no constituyen, ni deben considerarse como, asesoramiento o recomendaciones financieras, de inversión, de trading u otro tipo, proporcionadas o respaldadas por TradingView. Obtenga más información en Condiciones de uso.