
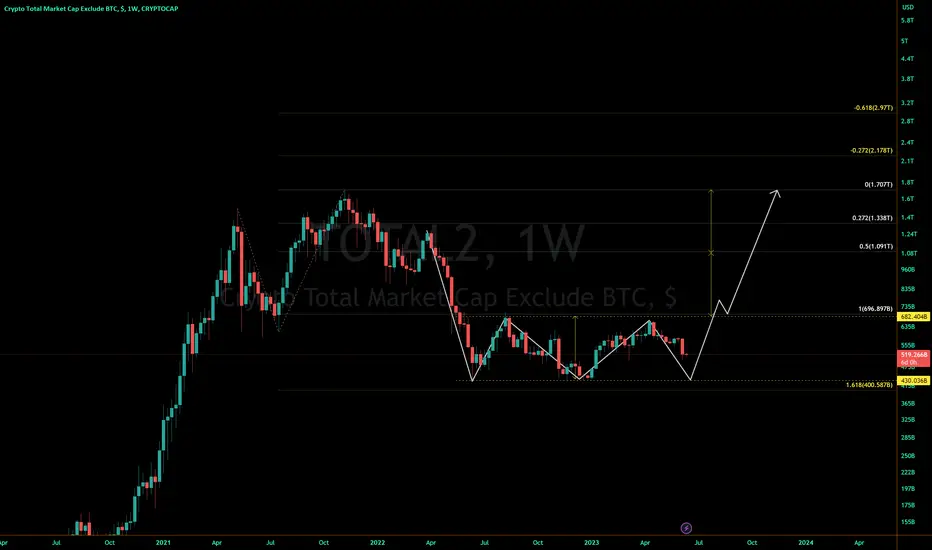
Total2 looks like an expanded flat completing its reversal at the end of a C wave.
It has twice bottomed just shy of the 1.618 for its trend-based fib, and may or may not reach a 3rd bottom near this area before exiting above its neckline.
If it doesn't reach bottom again, it's possible it could perform a move similar to what BTCUSD did here:

However, it has so far failed to maintain a breakout if we draw a similar wedge on Total2:

A 1x measured target lines up with its 50% trend-based fib, while the 2x measured target for the triple-bottom lines up exactly with its 0% fib, exactly where total2 reached its ATH.
This would go in line with my theory that movements in DXY could lead to recoveries across multiple markets that end in double-tops.
It has twice bottomed just shy of the 1.618 for its trend-based fib, and may or may not reach a 3rd bottom near this area before exiting above its neckline.
If it doesn't reach bottom again, it's possible it could perform a move similar to what
BTCUSD did here:However, it has so far failed to maintain a breakout if we draw a similar wedge on Total2:
A 1x measured target lines up with its 50% trend-based fib, while the 2x measured target for the triple-bottom lines up exactly with its 0% fib, exactly where total2 reached its ATH.
This would go in line with my theory that movements in DXY could lead to recoveries across multiple markets that end in double-tops.

Exención de responsabilidad
La información y las publicaciones no constituyen, ni deben considerarse como, asesoramiento o recomendaciones financieras, de inversión, de trading u otro tipo, proporcionadas o respaldadas por TradingView. Obtenga más información en Condiciones de uso.
Exención de responsabilidad
La información y las publicaciones no constituyen, ni deben considerarse como, asesoramiento o recomendaciones financieras, de inversión, de trading u otro tipo, proporcionadas o respaldadas por TradingView. Obtenga más información en Condiciones de uso.