
🔶Introduction
Volume Profile is one of the most powerful, yet widely misunderstood, tools in modern technical analysis. Unlike traditional volume indicators that simply show how much was traded per bar over time, Volume Profile rotates volume onto the price axis, revealing *where* the most trading activity occurred. This distinction is critical: it transforms volume from a timing metric into a structural map.
Originally rooted in Market Profile theory developed by J. Peter Steidlmayer at the Chicago Board of Trade in the 1980s (1), Volume Profile has since evolved into a standalone analytical framework. While Market Profile uses time-price-opportunity (TPO) letters to map market activity, Volume Profile focuses purely on traded volume at each price level, which makes it a more direct representation of market participation and acceptance.
This post provides a comprehensive deep dive into Volume Profile, split into two parts. Part I covers the concepts, components, and practical applications that every trader, from beginner to advanced, should understand. Part II dives into the technical construction: how Volume Profiles are actually built in code, including the two primary calculation methods used in TradingView: pivot-based profiling and request.footprint-based profiling.
Part II contains technical content aimed at Pine Script developers and traders who want to understand the engine behind the histogram. Feel free to skip to the sections most relevant to you.
---
🔶PART I: FOR TRADERS
Understanding, Reading & Applying Volume Profile
---
🔹1. What Volume Profile Shows
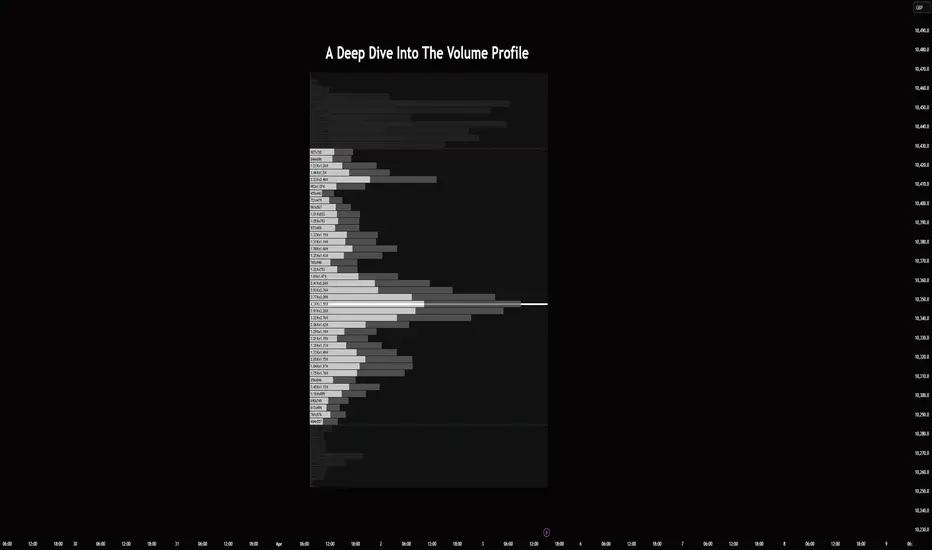
At its core, a Volume Profile is a horizontal histogram overlaid on a price chart. Each row of the histogram represents a price level (or price bin), and the width of the row represents the total volume traded at that level during a defined window.
Think of it as an X-ray of the market. While candlesticks show you what price did, Volume Profile shows you what price meant: which levels attracted genuine participation and which were simply passed through.
This is important because markets are auction processes. Price moves to find levels where buyers and sellers agree on value. Volume Profile makes that agreement (or disagreement) visible.
🔹2. Core Components
2.1 Value Area (VA)

The Value Area is the price range that contains a specified percentage of the total volume traded in the profile, typically 68% or 70%. This zone represents the area where the market found "fair value" during the profiled period.
The concept is grounded in a simple statistical idea: if we treat the volume distribution as roughly bell-shaped, approximately 68% of volume falls within one standard deviation of the mean. The Value Area captures this "zone of acceptance."
When price is trading inside the Value Area, the market is in balance, meaning participants broadly agree on value. When price escapes the Value Area, the market is exploring and searching for new acceptance or rejecting current levels.
2.2 VAH (Value Area High)

The Value Area High is the upper boundary of the Value Area. It represents the highest price level that is still considered part of "fair value."
VAH often acts as resistance when approached from below, and as support when price is trading above it. A sustained breakout above VAH signals that the market is accepting higher prices, and that new value is being established.
2.3 VAL (Value Area Low)

The Value Area Low is the lower boundary of the Value Area. It represents the lowest price level that is still considered part of "fair value."
VAL often acts as support when approached from above, and as resistance when price trades below it. A clean break below VAL signals that the market is rejecting the previous value zone and searching for lower acceptance.
2.4 POC (Point of Control)

The Point of Control is the single price level (row) with the highest traded volume in the entire profile. This is the "most accepted" price, the level where the most business was transacted.
The POC is the gravitational center of the profile. Price tends to return to the POC because it represents where the highest agreement between buyers and sellers occurred. In Market Profile terminology, the POC is the "fairest price."
When the POC is near the center of the profile, the distribution is balanced, reflecting symmetric acceptance. When the POC is skewed toward the top or bottom, it suggests directional acceptance and potential continuation.
2.5 HVN (High Volume Node)
A High Volume Node is any price level (or cluster of levels) with significantly elevated volume relative to its surroundings. HVNs represent zones of strong acceptance, areas where the market spent time and traded heavily.
HVNs act as magnets. Price tends to slow down, consolidate, and rotate around HVNs because both sides were actively participating at these levels. This makes HVNs natural support/resistance zones and areas where trend moves often stall.
2.6 LVN (Low Volume Node)
A Low Volume Node is any price level (or cluster of levels) with significantly reduced volume relative to its surroundings. LVNs represent zones of rejection, areas where the market passed through quickly without accepting value.
LVNs are transition zones. Price tends to move rapidly through LVNs because there is minimal trading interest at these levels. This makes LVNs natural areas for fast directional moves. However, if price returns to an LVN and *stalls*, it can indicate a potential shift in market structure, where a level that was previously rejected is now being tested for acceptance.
2.7 POV (Point of Void)

The Point of Void is a concept specific to the OutsiderEdge framework. It is defined as the lowest-volume row in the node (LVN) located *within* the Value Area. While generic LVNs can exist anywhere in the profile, including far outside the Value Area in thinly traded extremes, the POV isolates the thin spot inside fair value.
This distinction matters. An LVN outside the Value Area is expected because those are price extremes that saw minimal activity. But an LVN *inside* the Value Area is structurally significant: it reveals a pocket of disinterest embedded within what the market considers "accepted" value.
Price behavior around the POV tends to be binary: either price moves through it quickly (confirming the void), or it stalls and starts accepting, which can signal a structural shift in the profile. The POV effectively highlights where value is "weakest" and most vulnerable to a breakout or rotation.
🔹3. Profile Types & Windows
Volume Profiles can be built over different windows, and the choice of window fundamentally changes what the profile tells you.
3.1 Session Profiles

A session profile builds a new histogram for each trading session (e.g., 09:30 to 16:00 for US equities). This gives you a daily structural snapshot: where was today's POC? Where did value form? Did it overlap with yesterday's Value Area?
Session profiles are ideal for intraday traders who want consistent, repeatable structure. Each day starts fresh with clean levels and clean context.
3.2 Swing Profiles

A swing profile builds a histogram from one swing pivot to the next. Instead of using fixed time boundaries, it uses market structure to define the profile window. The profile captures "this move", from the last swing high to the last swing low, or vice versa.
Swing profiles are ideal for traders who think in terms of structure rather than sessions. The profile adapts to what the market is doing, not what the clock says.
3.3 Fixed Range Profiles

A fixed range profile lets the user manually define the start and end of the profile window. This gives maximum flexibility, allowing you to profile a specific impulse, a consolidation range, or any period you consider relevant.
3.4 Visible Range Profiles (VPVR)

A visible range profile builds a histogram across the entire visible chart window. This is the most common type found in TradingView's built-in tools and provides a broad overview of volume distribution across whatever you're looking at.
🔹4. How To Use Volume Profile**
4.1 Identifying Support & Resistance
Traditional support and resistance are drawn from price pivots, but Volume Profile reveals why certain levels hold. A price level that also coincides with an HVN or the POC is structurally stronger than a level based purely on a wick low or swing high.
Practical approach: look for confluence between price-based S/R and volume-based S/R. When a swing low aligns with a prominent HVN or the VAL from a recent session, that level carries structural weight.
4.2 Value Area Migration
One of the most powerful applications is tracking how the Value Area shifts from one session to the next. When consecutive sessions show rising VAHs and VALs, the market is building value at progressively higher levels, which is a strong sign of bullish acceptance. The reverse applies for bearish migration.
When a new session's Value Area overlaps significantly with the previous session's VA, the market is in balance, indicating range-bound conditions. When it gaps or separates, the market is in directional exploration.
4.3 POC as Decision Level
The POC is not just a support/resistance level. It is a decision level. When price approaches the POC, the question becomes: will price accept this level again, or reject it?
A breach of the POC with momentum suggests the previous "fairest price" is no longer valid, and the market is re-pricing. A rejection at the POC suggests the market still considers this level as fair value and is likely to rotate around it.
4.4 LVN & POV Breakouts
LVNs and POVs represent thin air, levels where the market previously showed no interest. When price approaches an LVN from one side, it often accelerates through it because there's no volume "wall" to slow it down.
However, the more interesting signal is when price *fails* to clear an LVN or POV. This failure indicates that a previously rejected level is now being contested, suggesting potential absorption, rotation, or reversal.
4.5 Developing vs Closed Profiles
A developing profile is still "alive", meaning the POC, VAH, and VAL are shifting as new volume comes in. A closed profile is fixed and represents a completed period.
Trading off developing profiles requires understanding that levels will move. Trading off closed profiles gives fixed reference points. Both have value, but they serve different purposes: developing profiles for real-time context, closed profiles for historical structure.
🔹5. Limitations
Volume Profile is a contextual tool, not a signal generator. It tells you *where* price might react, but not *when* or *how*. Key limitations include:
- Data dependency: On TradingView, intrabar volume data (via request.footprint) is only available on specific symbols and requires Premium/higher plans. Without intrabar data, profiles use bar-level estimation, which is less precise.
- No directional bias on its own: Volume Profile shows structure, not direction. You still need price action, momentum, or trend context to determine *how* to trade a level.
- Resolution tradeoff: More histogram rows means more precision but also more noise. Fewer rows means cleaner structure but potentially missed nuance.
- Lookback sensitivity: The profile window determines everything. A session profile and a swing profile on the same chart can show different POCs, and both are "correct" for their context.
---
🔶PART II: FOR DEVELOPERS
Building Volume Profiles in Pine Script
---
🔹6. Calculation Overview
Building a Volume Profile in Pine Script requires solving one core problem: distributing traded volume across discrete price levels (rows) within a defined window. There are two fundamentally different approaches to this in TradingView:
Method A: Pivot-Based Estimation (works on all plans, all symbols)
Method B: Request.Footprint Intrabar Data (requires Premium+, supported symbols)
Both methods produce a histogram, but they differ significantly in how they source and allocate volume. Understanding the distinction is critical for any developer building volume profile tools.
🔹7. Method A: Pivot-Based Profile Construction
This is the most common method for custom Pine Script volume profiles because it works universally with no special data requirements. The process involves defining a profile window (e.g., between two swing pivots or within a session), dividing that window's price range into rows, and then distributing each bar's volume across the rows it touches.
7.1 Step 1: Define the Profile Window
The window can be determined by swing pivots, sessions, or fixed range. For a swing-based profile:
Pine Script®
Each new pivot starts a new profile window. The bars between two consecutive pivots define which bars contribute volume to the profile.
7.2 Step 2: Define the Price Range & Rows
Once you have the window, determine the high and low of the range and divide it into N rows:
Each row represents a price band:
Pine Script®
7.3 Step 3: Distribute Volume Across Rows
For each bar within the profile window, determine which rows the bar touches (using the bar's high and low), then distribute the bar's volume equally across those rows:
Pine Script®
This is a simplified equal-distribution model. More advanced implementations may weight volume toward the close price, use OHLC proportional distribution, or incorporate tick-level estimation.
7.4 Step 4: Calculate POC, VA, VAH, VAL
Once all volume is distributed:
Pine Script®
7.5 Step 5: Identify HVN, LVN, POV
Pine Script®
7.6 Advantages & Limitations of Method A
Advantages:
- Works on all symbols, all timeframes, all TradingView plans
- Full control over profile window (pivot-based, session, custom)
- No dependency on broker-reported intrabar data
Limitations:
- Volume distribution is estimated, not exact per price level
- Equal distribution across touched rows assumes uniform volume within each bar, but in reality volume concentrates around certain prices within a bar
- Cannot distinguish buy vs sell volume (delta) without intrabar data
- Accuracy improves with lower timeframes (more bars = finer distribution)
🔹8. Method B: Request.Footprint Profile Construction
TradingView's `request.footprint()` function provides direct access to intrabar volume data, meaning actual tick volume traded at individual price levels within each bar. This is the same data used in footprint charts and represents a fundamentally more accurate approach.
8.1 How request.footprint Works
Pine Script®
Instead of estimating which rows a bar touches and distributing volume equally, `request.footprint` gives you the actual volume per price row within each bar. This means:
- You know exactly how much volume was traded at each price level
- You can separate buy volume from sell volume (delta)
- The profile is built from real microstructure data, not estimation
8.2 Building the Profile with Footprint Data
Pine Script®
The POC, VA, VAH, VAL, HVN, LVN, and POV calculations remain identical to Method A. The difference is purely in how volume is sourced and distributed. The output histogram is the same structure, but built from actual traded volume per price level rather than bar-level estimation.
8.3 Buy/Sell Decomposition & Delta
A key advantage of Method B is the ability to decompose volume into buy and sell components:
Pine Script®
This enables features like:
- CVD (Cumulative Volume Delta) at the POC
- Buy/sell pressure bars per profile row
- Absorption detection (high volume + low delta = both sides trading equally)
8.4 Advantages & Limitations of Method B
Advantages:
- Actual volume per price level, with no estimation required
- Buy/sell decomposition for delta and absorption analysis
- Higher accuracy profiles, especially on higher timeframes
- Matches what institutional tools (Sierra Chart, ATAS, Bookmap) show
Limitations:
- Requires TradingView Premium or higher plan
- Not available on all symbols (depends on exchange/broker data)
- `request.footprint` has computational limits (max bars, max rows)
- Intrabar resolution affects granularity (1-min intrabar on a daily chart = 390 data points for US equities)
🔹10. Comparing Method A vs Method B
Method A: Pivot / Bar-Based Volume Profile
This method builds the profile from standard bar data such as open, high, low, close, and volume.
Because bar data does not show the exact traded volume at each price level, the volume must be estimated across the range of the candle.
Advantages:
Any TradingView plan can use it
Works across virtually all symbols
Lower computational load
Complete flexibility over the profile window
Limitations:
Volume distribution is estimated, not exact
No true buy vs sell separation
Less precise than intrabar-based methods
Best for:
Universal deployment, broad market coverage, and lightweight volume profile analysis
Method B: Footprint / Intrabar Volume Profile
This method uses intrabar price rows to build the profile from actual traded volume at each price level.
That makes it far more precise and also enables native order flow features such as delta, buy volume, and sell volume.
Advantages:
Actual traded volume by price level
Native buy/sell separation
Much higher analytical precision
Full flexibility over the profile window
Limitations:
Requires Premium or higher depending on data access
Limited symbol support because not all markets provide tick-level depth
Higher computational cost
Best for:
Precision analysis, footprint workflows, and deeper order flow insight
In practice, Method A is what most custom Pine Script indicators use because of its universal compatibility. Method B is the gold standard when available and is what professional orderflow platforms use internally, but on real volume data instead of tick data.
A hybrid approach is also possible: use Method A as the default fallback, and upgrade to Method B when the symbol and plan support it. This gives you the best of both, with universal coverage plus precision where it matters.
🔹10. Rendering Considerations
Drawing a Volume Profile on a TradingView chart involves creating box or line objects for each row. Key considerations:
Pine Script®
Color coding the histogram (inside VA vs outside VA) and highlighting the POC row adds visual clarity:
Pine Script®
🔹11. Extending Volume Profile: Advanced Concepts
11.1 Developing POC
Track how the POC migrates as the profile develops bar-by-bar. A stable POC suggests strong acceptance at one level. A migrating POC indicates shifting value and potential directional bias.
11.2 Naked POC / Naked VAH / Naked VAL
Levels from closed profiles that have never been revisited by price. These "naked" levels often act as strong magnets when price eventually returns to them.
11.3 Value Area Overlap
Comparing consecutive session Value Areas reveals market state:
- High overlap = balance / range conditions
- No overlap (gap) = initiative activity / trend conditions
- Partial overlap with migration = measured trend
11.4 Composite Profiles
Merging multiple session profiles into one composite profile reveals the broader structural picture. A multi-day composite POC carries more weight than a single session POC.
---
References
(1) Steidlmayer, J.P. and Koy, K. "Markets and Market Logic." The Porcupine Press (1986).
(2) Dalton, J., Jones, E., and Dalton, R. "Mind Over Markets: Power Trading with Market Generated Information." Wiley (1993).
(3) TradingView Pine Script Language Reference Manual, `request.footprint()`, tradingview.com/pine-script-reference/
---
All content provided by OutsiderEdge is for informational & educational purposes only. Past performance does not guarantee future results. You are solely responsible for your trading decisions and risk management.
Volume Profile is one of the most powerful, yet widely misunderstood, tools in modern technical analysis. Unlike traditional volume indicators that simply show how much was traded per bar over time, Volume Profile rotates volume onto the price axis, revealing *where* the most trading activity occurred. This distinction is critical: it transforms volume from a timing metric into a structural map.
Originally rooted in Market Profile theory developed by J. Peter Steidlmayer at the Chicago Board of Trade in the 1980s (1), Volume Profile has since evolved into a standalone analytical framework. While Market Profile uses time-price-opportunity (TPO) letters to map market activity, Volume Profile focuses purely on traded volume at each price level, which makes it a more direct representation of market participation and acceptance.
This post provides a comprehensive deep dive into Volume Profile, split into two parts. Part I covers the concepts, components, and practical applications that every trader, from beginner to advanced, should understand. Part II dives into the technical construction: how Volume Profiles are actually built in code, including the two primary calculation methods used in TradingView: pivot-based profiling and request.footprint-based profiling.
Part II contains technical content aimed at Pine Script developers and traders who want to understand the engine behind the histogram. Feel free to skip to the sections most relevant to you.
---
🔶PART I: FOR TRADERS
Understanding, Reading & Applying Volume Profile
---
🔹1. What Volume Profile Shows
At its core, a Volume Profile is a horizontal histogram overlaid on a price chart. Each row of the histogram represents a price level (or price bin), and the width of the row represents the total volume traded at that level during a defined window.
Think of it as an X-ray of the market. While candlesticks show you what price did, Volume Profile shows you what price meant: which levels attracted genuine participation and which were simply passed through.
This is important because markets are auction processes. Price moves to find levels where buyers and sellers agree on value. Volume Profile makes that agreement (or disagreement) visible.
🔹2. Core Components
2.1 Value Area (VA)
The Value Area is the price range that contains a specified percentage of the total volume traded in the profile, typically 68% or 70%. This zone represents the area where the market found "fair value" during the profiled period.
The concept is grounded in a simple statistical idea: if we treat the volume distribution as roughly bell-shaped, approximately 68% of volume falls within one standard deviation of the mean. The Value Area captures this "zone of acceptance."
Value Area = The price range containing X% of total profiled volume (default: 68%)
When price is trading inside the Value Area, the market is in balance, meaning participants broadly agree on value. When price escapes the Value Area, the market is exploring and searching for new acceptance or rejecting current levels.
2.2 VAH (Value Area High)
The Value Area High is the upper boundary of the Value Area. It represents the highest price level that is still considered part of "fair value."
VAH often acts as resistance when approached from below, and as support when price is trading above it. A sustained breakout above VAH signals that the market is accepting higher prices, and that new value is being established.
VAH = Upper boundary of the Value Area
= Highest price row still inside the X% volume zone
2.3 VAL (Value Area Low)
The Value Area Low is the lower boundary of the Value Area. It represents the lowest price level that is still considered part of "fair value."
VAL often acts as support when approached from above, and as resistance when price trades below it. A clean break below VAL signals that the market is rejecting the previous value zone and searching for lower acceptance.
VAL = Lower boundary of the Value Area
= Lowest price row still inside the X% volume zone
2.4 POC (Point of Control)
The Point of Control is the single price level (row) with the highest traded volume in the entire profile. This is the "most accepted" price, the level where the most business was transacted.
The POC is the gravitational center of the profile. Price tends to return to the POC because it represents where the highest agreement between buyers and sellers occurred. In Market Profile terminology, the POC is the "fairest price."
POC = max(volume[row]) for all rows in the profile
= The price row with the single highest volume
When the POC is near the center of the profile, the distribution is balanced, reflecting symmetric acceptance. When the POC is skewed toward the top or bottom, it suggests directional acceptance and potential continuation.
2.5 HVN (High Volume Node)
A High Volume Node is any price level (or cluster of levels) with significantly elevated volume relative to its surroundings. HVNs represent zones of strong acceptance, areas where the market spent time and traded heavily.
HVNs act as magnets. Price tends to slow down, consolidate, and rotate around HVNs because both sides were actively participating at these levels. This makes HVNs natural support/resistance zones and areas where trend moves often stall.
HVN = Price level where volume is significantly above the local average
= Zones of acceptance, consolidation, and mean-reversion
2.6 LVN (Low Volume Node)
A Low Volume Node is any price level (or cluster of levels) with significantly reduced volume relative to its surroundings. LVNs represent zones of rejection, areas where the market passed through quickly without accepting value.
LVNs are transition zones. Price tends to move rapidly through LVNs because there is minimal trading interest at these levels. This makes LVNs natural areas for fast directional moves. However, if price returns to an LVN and *stalls*, it can indicate a potential shift in market structure, where a level that was previously rejected is now being tested for acceptance.
LVN = Price level where volume is significantly below the local average
= Zones of rejection, fast transitions, and breakout potential
2.7 POV (Point of Void)
The Point of Void is a concept specific to the OutsiderEdge framework. It is defined as the lowest-volume row in the node (LVN) located *within* the Value Area. While generic LVNs can exist anywhere in the profile, including far outside the Value Area in thinly traded extremes, the POV isolates the thin spot inside fair value.
This distinction matters. An LVN outside the Value Area is expected because those are price extremes that saw minimal activity. But an LVN *inside* the Value Area is structurally significant: it reveals a pocket of disinterest embedded within what the market considers "accepted" value.
POV = min(volume[row]) for all rows where VAL ≤ row ≤ VAH
= The thinnest price row inside the Value Area
Price behavior around the POV tends to be binary: either price moves through it quickly (confirming the void), or it stalls and starts accepting, which can signal a structural shift in the profile. The POV effectively highlights where value is "weakest" and most vulnerable to a breakout or rotation.
🔹3. Profile Types & Windows
Volume Profiles can be built over different windows, and the choice of window fundamentally changes what the profile tells you.
3.1 Session Profiles
A session profile builds a new histogram for each trading session (e.g., 09:30 to 16:00 for US equities). This gives you a daily structural snapshot: where was today's POC? Where did value form? Did it overlap with yesterday's Value Area?
Session profiles are ideal for intraday traders who want consistent, repeatable structure. Each day starts fresh with clean levels and clean context.
3.2 Swing Profiles
A swing profile builds a histogram from one swing pivot to the next. Instead of using fixed time boundaries, it uses market structure to define the profile window. The profile captures "this move", from the last swing high to the last swing low, or vice versa.
Swing profiles are ideal for traders who think in terms of structure rather than sessions. The profile adapts to what the market is doing, not what the clock says.
3.3 Fixed Range Profiles
A fixed range profile lets the user manually define the start and end of the profile window. This gives maximum flexibility, allowing you to profile a specific impulse, a consolidation range, or any period you consider relevant.
3.4 Visible Range Profiles (VPVR)
A visible range profile builds a histogram across the entire visible chart window. This is the most common type found in TradingView's built-in tools and provides a broad overview of volume distribution across whatever you're looking at.
🔹4. How To Use Volume Profile**
4.1 Identifying Support & Resistance
Traditional support and resistance are drawn from price pivots, but Volume Profile reveals why certain levels hold. A price level that also coincides with an HVN or the POC is structurally stronger than a level based purely on a wick low or swing high.
Practical approach: look for confluence between price-based S/R and volume-based S/R. When a swing low aligns with a prominent HVN or the VAL from a recent session, that level carries structural weight.
4.2 Value Area Migration
One of the most powerful applications is tracking how the Value Area shifts from one session to the next. When consecutive sessions show rising VAHs and VALs, the market is building value at progressively higher levels, which is a strong sign of bullish acceptance. The reverse applies for bearish migration.
When a new session's Value Area overlaps significantly with the previous session's VA, the market is in balance, indicating range-bound conditions. When it gaps or separates, the market is in directional exploration.
4.3 POC as Decision Level
The POC is not just a support/resistance level. It is a decision level. When price approaches the POC, the question becomes: will price accept this level again, or reject it?
A breach of the POC with momentum suggests the previous "fairest price" is no longer valid, and the market is re-pricing. A rejection at the POC suggests the market still considers this level as fair value and is likely to rotate around it.
4.4 LVN & POV Breakouts
LVNs and POVs represent thin air, levels where the market previously showed no interest. When price approaches an LVN from one side, it often accelerates through it because there's no volume "wall" to slow it down.
However, the more interesting signal is when price *fails* to clear an LVN or POV. This failure indicates that a previously rejected level is now being contested, suggesting potential absorption, rotation, or reversal.
4.5 Developing vs Closed Profiles
A developing profile is still "alive", meaning the POC, VAH, and VAL are shifting as new volume comes in. A closed profile is fixed and represents a completed period.
Trading off developing profiles requires understanding that levels will move. Trading off closed profiles gives fixed reference points. Both have value, but they serve different purposes: developing profiles for real-time context, closed profiles for historical structure.
🔹5. Limitations
Volume Profile is a contextual tool, not a signal generator. It tells you *where* price might react, but not *when* or *how*. Key limitations include:
- Data dependency: On TradingView, intrabar volume data (via request.footprint) is only available on specific symbols and requires Premium/higher plans. Without intrabar data, profiles use bar-level estimation, which is less precise.
- No directional bias on its own: Volume Profile shows structure, not direction. You still need price action, momentum, or trend context to determine *how* to trade a level.
- Resolution tradeoff: More histogram rows means more precision but also more noise. Fewer rows means cleaner structure but potentially missed nuance.
- Lookback sensitivity: The profile window determines everything. A session profile and a swing profile on the same chart can show different POCs, and both are "correct" for their context.
---
🔶PART II: FOR DEVELOPERS
Building Volume Profiles in Pine Script
---
🔹6. Calculation Overview
Building a Volume Profile in Pine Script requires solving one core problem: distributing traded volume across discrete price levels (rows) within a defined window. There are two fundamentally different approaches to this in TradingView:
Method A: Pivot-Based Estimation (works on all plans, all symbols)
Method B: Request.Footprint Intrabar Data (requires Premium+, supported symbols)
Both methods produce a histogram, but they differ significantly in how they source and allocate volume. Understanding the distinction is critical for any developer building volume profile tools.
🔹7. Method A: Pivot-Based Profile Construction
This is the most common method for custom Pine Script volume profiles because it works universally with no special data requirements. The process involves defining a profile window (e.g., between two swing pivots or within a session), dividing that window's price range into rows, and then distributing each bar's volume across the rows it touches.
7.1 Step 1: Define the Profile Window
The window can be determined by swing pivots, sessions, or fixed range. For a swing-based profile:
Each new pivot starts a new profile window. The bars between two consecutive pivots define which bars contribute volume to the profile.
7.2 Step 2: Define the Price Range & Rows
Once you have the window, determine the high and low of the range and divide it into N rows:
rangeHigh = highest high within the profile window
rangeLow = lowest low within the profile window
rowHeight = (rangeHigh - rangeLow) / numRows
Each row represents a price band:
7.3 Step 3: Distribute Volume Across Rows
For each bar within the profile window, determine which rows the bar touches (using the bar's high and low), then distribute the bar's volume equally across those rows:
This is a simplified equal-distribution model. More advanced implementations may weight volume toward the close price, use OHLC proportional distribution, or incorporate tick-level estimation.
7.4 Step 4: Calculate POC, VA, VAH, VAL
Once all volume is distributed:
7.5 Step 5: Identify HVN, LVN, POV
7.6 Advantages & Limitations of Method A
Advantages:
- Works on all symbols, all timeframes, all TradingView plans
- Full control over profile window (pivot-based, session, custom)
- No dependency on broker-reported intrabar data
Limitations:
- Volume distribution is estimated, not exact per price level
- Equal distribution across touched rows assumes uniform volume within each bar, but in reality volume concentrates around certain prices within a bar
- Cannot distinguish buy vs sell volume (delta) without intrabar data
- Accuracy improves with lower timeframes (more bars = finer distribution)
🔹8. Method B: Request.Footprint Profile Construction
TradingView's `request.footprint()` function provides direct access to intrabar volume data, meaning actual tick volume traded at individual price levels within each bar. This is the same data used in footprint charts and represents a fundamentally more accurate approach.
8.1 How request.footprint Works
Instead of estimating which rows a bar touches and distributing volume equally, `request.footprint` gives you the actual volume per price row within each bar. This means:
- You know exactly how much volume was traded at each price level
- You can separate buy volume from sell volume (delta)
- The profile is built from real microstructure data, not estimation
8.2 Building the Profile with Footprint Data
The POC, VA, VAH, VAL, HVN, LVN, and POV calculations remain identical to Method A. The difference is purely in how volume is sourced and distributed. The output histogram is the same structure, but built from actual traded volume per price level rather than bar-level estimation.
8.3 Buy/Sell Decomposition & Delta
A key advantage of Method B is the ability to decompose volume into buy and sell components:
This enables features like:
- CVD (Cumulative Volume Delta) at the POC
- Buy/sell pressure bars per profile row
- Absorption detection (high volume + low delta = both sides trading equally)
8.4 Advantages & Limitations of Method B
Advantages:
- Actual volume per price level, with no estimation required
- Buy/sell decomposition for delta and absorption analysis
- Higher accuracy profiles, especially on higher timeframes
- Matches what institutional tools (Sierra Chart, ATAS, Bookmap) show
Limitations:
- Requires TradingView Premium or higher plan
- Not available on all symbols (depends on exchange/broker data)
- `request.footprint` has computational limits (max bars, max rows)
- Intrabar resolution affects granularity (1-min intrabar on a daily chart = 390 data points for US equities)
🔹10. Comparing Method A vs Method B
Method A: Pivot / Bar-Based Volume Profile
This method builds the profile from standard bar data such as open, high, low, close, and volume.
Because bar data does not show the exact traded volume at each price level, the volume must be estimated across the range of the candle.
Advantages:
Any TradingView plan can use it
Works across virtually all symbols
Lower computational load
Complete flexibility over the profile window
Limitations:
Volume distribution is estimated, not exact
No true buy vs sell separation
Less precise than intrabar-based methods
Best for:
Universal deployment, broad market coverage, and lightweight volume profile analysis
Method B: Footprint / Intrabar Volume Profile
This method uses intrabar price rows to build the profile from actual traded volume at each price level.
That makes it far more precise and also enables native order flow features such as delta, buy volume, and sell volume.
Advantages:
Actual traded volume by price level
Native buy/sell separation
Much higher analytical precision
Full flexibility over the profile window
Limitations:
Requires Premium or higher depending on data access
Limited symbol support because not all markets provide tick-level depth
Higher computational cost
Best for:
Precision analysis, footprint workflows, and deeper order flow insight
In practice, Method A is what most custom Pine Script indicators use because of its universal compatibility. Method B is the gold standard when available and is what professional orderflow platforms use internally, but on real volume data instead of tick data.
A hybrid approach is also possible: use Method A as the default fallback, and upgrade to Method B when the symbol and plan support it. This gives you the best of both, with universal coverage plus precision where it matters.
🔹10. Rendering Considerations
Drawing a Volume Profile on a TradingView chart involves creating box or line objects for each row. Key considerations:
Color coding the histogram (inside VA vs outside VA) and highlighting the POC row adds visual clarity:
🔹11. Extending Volume Profile: Advanced Concepts
11.1 Developing POC
Track how the POC migrates as the profile develops bar-by-bar. A stable POC suggests strong acceptance at one level. A migrating POC indicates shifting value and potential directional bias.
11.2 Naked POC / Naked VAH / Naked VAL
Levels from closed profiles that have never been revisited by price. These "naked" levels often act as strong magnets when price eventually returns to them.
11.3 Value Area Overlap
Comparing consecutive session Value Areas reveals market state:
- High overlap = balance / range conditions
- No overlap (gap) = initiative activity / trend conditions
- Partial overlap with migration = measured trend
11.4 Composite Profiles
Merging multiple session profiles into one composite profile reveals the broader structural picture. A multi-day composite POC carries more weight than a single session POC.
---
References
(1) Steidlmayer, J.P. and Koy, K. "Markets and Market Logic." The Porcupine Press (1986).
(2) Dalton, J., Jones, E., and Dalton, R. "Mind Over Markets: Power Trading with Market Generated Information." Wiley (1993).
(3) TradingView Pine Script Language Reference Manual, `request.footprint()`, tradingview.com/pine-script-reference/
---
All content provided by OutsiderEdge is for informational & educational purposes only. Past performance does not guarantee future results. You are solely responsible for your trading decisions and risk management.

Try the indicators & strategies for free: whop.com/outsider-edge-ee31/
Join the Discord: discord.gg/DpKqqSSJAe
Visit the website: outsideredge.com/
All content provided is for informational & educational purposes only.
Join the Discord: discord.gg/DpKqqSSJAe
Visit the website: outsideredge.com/
All content provided is for informational & educational purposes only.
Exención de responsabilidad
La información y las publicaciones no constituyen, ni deben considerarse como, asesoramiento o recomendaciones financieras, de inversión, de trading u otro tipo, proporcionadas o respaldadas por TradingView. Obtenga más información en Condiciones de uso.
Try the indicators & strategies for free: whop.com/outsider-edge-ee31/
Join the Discord: discord.gg/DpKqqSSJAe
Visit the website: outsideredge.com/
All content provided is for informational & educational purposes only.
Join the Discord: discord.gg/DpKqqSSJAe
Visit the website: outsideredge.com/
All content provided is for informational & educational purposes only.
Exención de responsabilidad
La información y las publicaciones no constituyen, ni deben considerarse como, asesoramiento o recomendaciones financieras, de inversión, de trading u otro tipo, proporcionadas o respaldadas por TradingView. Obtenga más información en Condiciones de uso.