
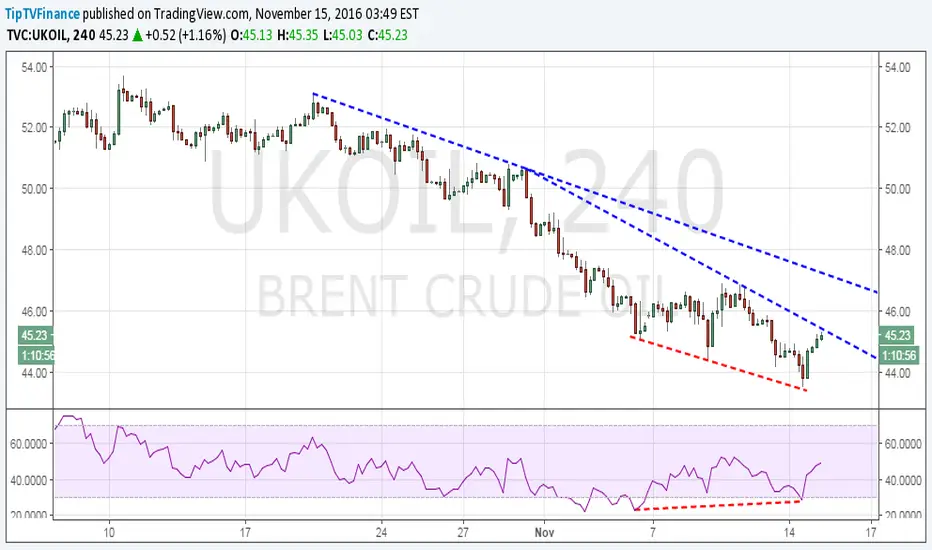
The 4-hour chart shows a bullish price RSI divergence followed by a rise to the descending trend line hurdle.
Oil bulls now await a breach of the trend line hurdle, following which the prices could rise to $46.90 (larger descending trend line hurdle)
On the other hand, a repeated failure to take out trend line hurdle would open doors for a revisit to a recent low of $43.55.
Oil bulls now await a breach of the trend line hurdle, following which the prices could rise to $46.90 (larger descending trend line hurdle)
On the other hand, a repeated failure to take out trend line hurdle would open doors for a revisit to a recent low of $43.55.

Exención de responsabilidad
La información y las publicaciones no constituyen, ni deben considerarse como, asesoramiento o recomendaciones financieras, de inversión, de trading u otro tipo, proporcionadas o respaldadas por TradingView. Obtenga más información en Condiciones de uso.
Exención de responsabilidad
La información y las publicaciones no constituyen, ni deben considerarse como, asesoramiento o recomendaciones financieras, de inversión, de trading u otro tipo, proporcionadas o respaldadas por TradingView. Obtenga más información en Condiciones de uso.