Crude oil Nears Support; Bearish Outlook | $UKOil #Brent #Forex
Friends,
Oil has been in a downfall over the past several weeks, based on a variety of fundamental opinions, be it geo-strategically, cyclically or economically driven.
GEOMETRY:
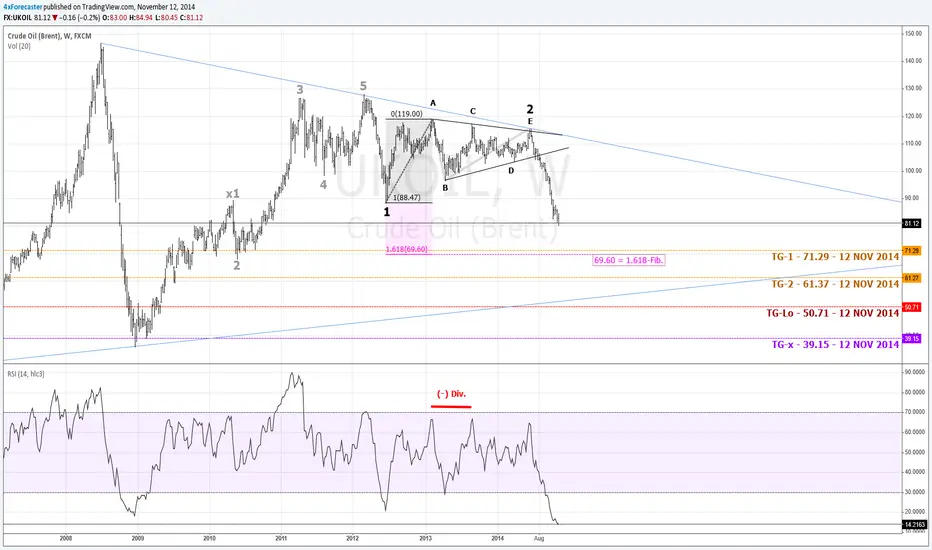
Technically speaking, since mid-July 2014, price resolved itself out of a geometry following a protracted sideways defined by the A-B-C-D-E points. From July 14th to August 04th, price coiled about the lower border of that geometry, and since fell in a consistent angle with no interim rallies.
ELLIOTT WAVE:
This straight, near linear fall is reminiscent of an Elliott Wave core impulsive move, typical of its internal Wave-3, thus suggesting that the prior triangle that held price into suspension over several months was likely the unfolding of a preceding Wave-1 and Wave-2.
FIBONACCI:
From a standard 1.618-Fibonacci extension, then a mere projection using Wave-1 and Wave-2 as anchors would define a possible support at:
(Wave-1 / Wave-2) x 1.618-Fib = 69.60.
This level gains credence on the basis that:
1 - It aligns with a historical support when a prior Wave-2 (grey shade to the left) offered support to a historical level via the intermediary of a Wave-3 impulse.
and
2 - It also aligns well with the predictive/forecasting model's first forecast, namely:
- TG-1 - 71.29 - 12 NOV 2014
PREDICTIVE/FORECASTING MODEL;
Looking at the entire predictive/forecasting model's targets, there are two NUMERICAL targets:
1 - TG-1 - 71.29 - 12 NOV 2014
and
2 - TG-2 - 61.37 - 12 NOV 2014,
as well as two NOMINAL targets:
1 - TG-Lo - 50.71 - 12 NOV 2014
and
2 - TG-x - 39.15 - 12 NOV 2014.
As explained in prior analyses/charts, the numerical targets offer a HIGHER probability of hit, but a lesser level of reversibility. This means that IF and ONCE hit, price will likely RETRACE in a Fibonacci order, between 0.382 and 0.618.
In contrast, the nominal targets offer a LESSER probability of hit. This means that if and once hit, price will likely REVERSE (and not just retrace) in a Fibonacci order that should exceed 0.618, and potentially attain extensions in the 1.131, 1.414, or 1.618 order.
OVERALL:
Trend is decisively bearish. Both Fibonacci measures and predictive/forecasting model have defined a nearby support level in the 69.60-to-71.29 range. However, on its own, the model suggest a potentially deeper attainment levels of diminishing probability, but increasing structural relevance.
Cheers,
David Alcindor
Predictive Analysis & Forecasting
Denver, Colorado - USA
----------
Twitter: 4xForecaster
----------
Oil has been in a downfall over the past several weeks, based on a variety of fundamental opinions, be it geo-strategically, cyclically or economically driven.
GEOMETRY:
Technically speaking, since mid-July 2014, price resolved itself out of a geometry following a protracted sideways defined by the A-B-C-D-E points. From July 14th to August 04th, price coiled about the lower border of that geometry, and since fell in a consistent angle with no interim rallies.
ELLIOTT WAVE:
This straight, near linear fall is reminiscent of an Elliott Wave core impulsive move, typical of its internal Wave-3, thus suggesting that the prior triangle that held price into suspension over several months was likely the unfolding of a preceding Wave-1 and Wave-2.
FIBONACCI:
From a standard 1.618-Fibonacci extension, then a mere projection using Wave-1 and Wave-2 as anchors would define a possible support at:
(Wave-1 / Wave-2) x 1.618-Fib = 69.60.
This level gains credence on the basis that:
1 - It aligns with a historical support when a prior Wave-2 (grey shade to the left) offered support to a historical level via the intermediary of a Wave-3 impulse.
and
2 - It also aligns well with the predictive/forecasting model's first forecast, namely:
- TG-1 - 71.29 - 12 NOV 2014
PREDICTIVE/FORECASTING MODEL;
Looking at the entire predictive/forecasting model's targets, there are two NUMERICAL targets:
1 - TG-1 - 71.29 - 12 NOV 2014
and
2 - TG-2 - 61.37 - 12 NOV 2014,
as well as two NOMINAL targets:
1 - TG-Lo - 50.71 - 12 NOV 2014
and
2 - TG-x - 39.15 - 12 NOV 2014.
As explained in prior analyses/charts, the numerical targets offer a HIGHER probability of hit, but a lesser level of reversibility. This means that IF and ONCE hit, price will likely RETRACE in a Fibonacci order, between 0.382 and 0.618.
In contrast, the nominal targets offer a LESSER probability of hit. This means that if and once hit, price will likely REVERSE (and not just retrace) in a Fibonacci order that should exceed 0.618, and potentially attain extensions in the 1.131, 1.414, or 1.618 order.
OVERALL:
Trend is decisively bearish. Both Fibonacci measures and predictive/forecasting model have defined a nearby support level in the 69.60-to-71.29 range. However, on its own, the model suggest a potentially deeper attainment levels of diminishing probability, but increasing structural relevance.
Cheers,
David Alcindor
Predictive Analysis & Forecasting
Denver, Colorado - USA
----------
Twitter: 4xForecaster
----------
Nota
11 FEB 2016 - Chart Update:Here is to hitting ALL targets, looking back at the charts from first posting ... 15 months ago:
Best,
David Alcindor
PS:
Most recent chart;
Nota
11 FEB 2016 - ADDENDUM: At 1.618-Fib, price may have reached a nadir in
 UKOIL:
Best,
David Alcindor
Nota
11 FEB 2016 - ADDENDUM #2:Look for $17.21 being the next probable level of support if 1.618-Fib fails ... This would loosely correspond to the original
USOIL's 21.02 target defined in FEB 2015:Best,
David Alcindor

Publicaciones relacionadas
Exención de responsabilidad
La información y las publicaciones no constituyen, ni deben considerarse como, asesoramiento o recomendaciones financieras, de inversión, de trading u otro tipo, proporcionadas o respaldadas por TradingView. Obtenga más información en Condiciones de uso.
Publicaciones relacionadas
Exención de responsabilidad
La información y las publicaciones no constituyen, ni deben considerarse como, asesoramiento o recomendaciones financieras, de inversión, de trading u otro tipo, proporcionadas o respaldadas por TradingView. Obtenga más información en Condiciones de uso.