
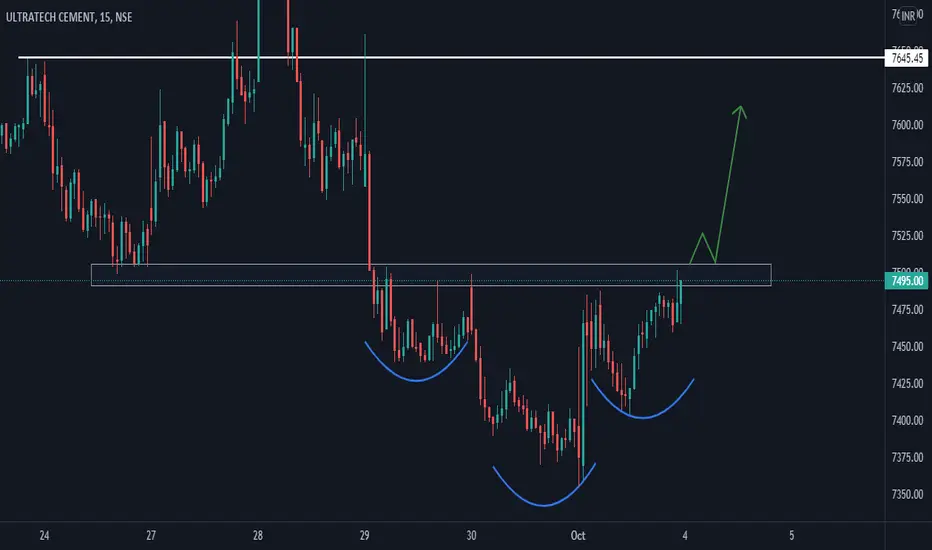
EXPLANATION: This is a 15 min time frame chart of ULTRACEMCO . The stock has been in a downtrend for days and has formed an Inverted head and shoulders pattern. If stock give a strong breakout and broke its supply zone with volumes and has retested the same. I am bullish on ULTRACEMCO .
If you like this analysis give a Like // Follow for more updates , let me know in comments below :)
If you like this analysis give a Like // Follow for more updates , let me know in comments below :)

Exención de responsabilidad
La información y las publicaciones no constituyen, ni deben considerarse como, asesoramiento o recomendaciones financieras, de inversión, de trading u otro tipo, proporcionadas o respaldadas por TradingView. Obtenga más información en Condiciones de uso.
Exención de responsabilidad
La información y las publicaciones no constituyen, ni deben considerarse como, asesoramiento o recomendaciones financieras, de inversión, de trading u otro tipo, proporcionadas o respaldadas por TradingView. Obtenga más información en Condiciones de uso.