
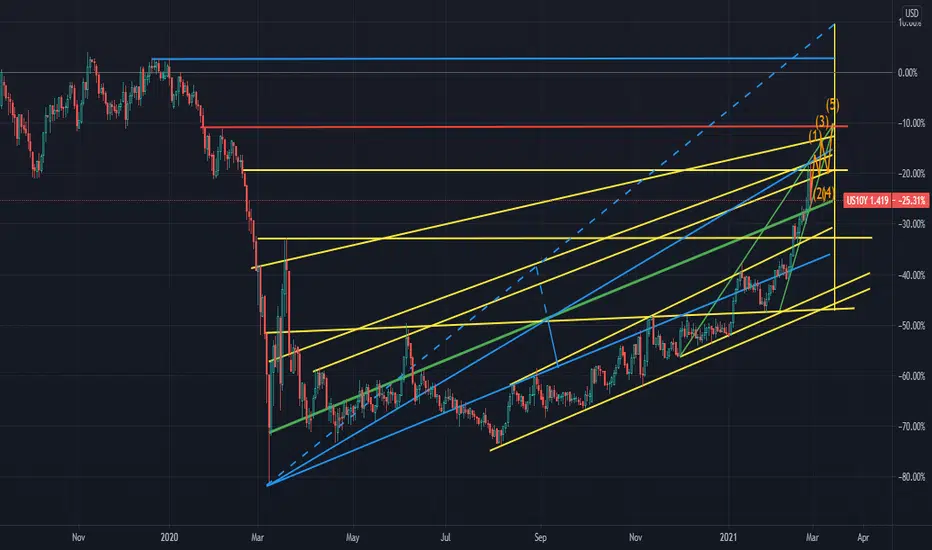
Hi there, as I draw, in my idea the US10Y Yield will rise till the level 1,68, I put the stop as a red line, as you see many levels form that triangle that ends to the resistance of February 2020.
I drawed green lines to support the rising, as you see the week ends, using that line as support, maybe because is slowing down from the 1,5% peak, but well it didn't go far away from that layer.
Using the bottom from March there is a projection that i draw with the blue dashed line, but in my opinion is weaker than "the yellow pattern".
I tried to figure out a trend myself
Let me know your opinion about.
Thank you :)
I drawed green lines to support the rising, as you see the week ends, using that line as support, maybe because is slowing down from the 1,5% peak, but well it didn't go far away from that layer.
Using the bottom from March there is a projection that i draw with the blue dashed line, but in my opinion is weaker than "the yellow pattern".
I tried to figure out a trend myself
Let me know your opinion about.
Thank you :)

Exención de responsabilidad
La información y las publicaciones no constituyen, ni deben considerarse como, asesoramiento o recomendaciones financieras, de inversión, de trading u otro tipo, proporcionadas o respaldadas por TradingView. Obtenga más información en Condiciones de uso.
Exención de responsabilidad
La información y las publicaciones no constituyen, ni deben considerarse como, asesoramiento o recomendaciones financieras, de inversión, de trading u otro tipo, proporcionadas o respaldadas por TradingView. Obtenga más información en Condiciones de uso.