Corto
SP500 Forecast
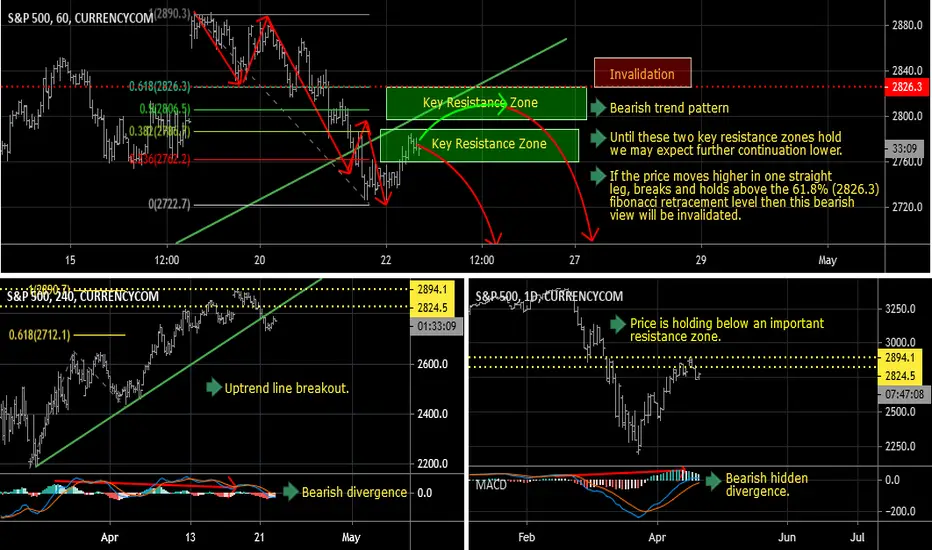
D1 - Price respected an important resistance zone and is holding below it, bearish hidden divergence.
H4 - Price has broken below the most recent uptrend line, bearish divergence.
H1 - Bearish trend pattern, until the two key resistance zones shown in the chart holds my view remains bearish here.
If the price moves higher in one straight leg, breaks and holds above the 61.8% (2826.3) fibonacci retracement level then this bearish view will be invalidated.
H4 - Price has broken below the most recent uptrend line, bearish divergence.
H1 - Bearish trend pattern, until the two key resistance zones shown in the chart holds my view remains bearish here.
If the price moves higher in one straight leg, breaks and holds above the 61.8% (2826.3) fibonacci retracement level then this bearish view will be invalidated.

Exención de responsabilidad
La información y las publicaciones no constituyen, ni deben considerarse como, asesoramiento o recomendaciones financieras, de inversión, de trading u otro tipo, proporcionadas o respaldadas por TradingView. Obtenga más información en Condiciones de uso.
Exención de responsabilidad
La información y las publicaciones no constituyen, ni deben considerarse como, asesoramiento o recomendaciones financieras, de inversión, de trading u otro tipo, proporcionadas o respaldadas por TradingView. Obtenga más información en Condiciones de uso.