Uncertain S&P 500
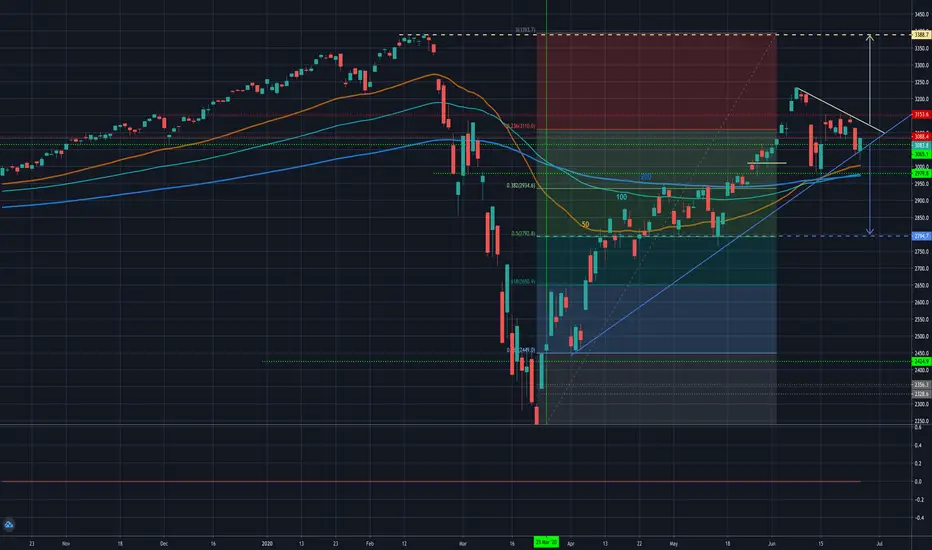
On my chart, you can see the triangle in which the price moves, the lower border of the triangle is indicated by blue colors and when it breaks down it can lead to a further drop in the price. And there is also the upper border of the triangle marked in yellow and when it is broken up, it will be a signal of further restoration of the market up to the previous maximum prices

Exención de responsabilidad
La información y las publicaciones no constituyen, ni deben considerarse como, asesoramiento o recomendaciones financieras, de inversión, de trading u otro tipo, proporcionadas o respaldadas por TradingView. Obtenga más información en Condiciones de uso.
Exención de responsabilidad
La información y las publicaciones no constituyen, ni deben considerarse como, asesoramiento o recomendaciones financieras, de inversión, de trading u otro tipo, proporcionadas o respaldadas por TradingView. Obtenga más información en Condiciones de uso.