SPX Monthly
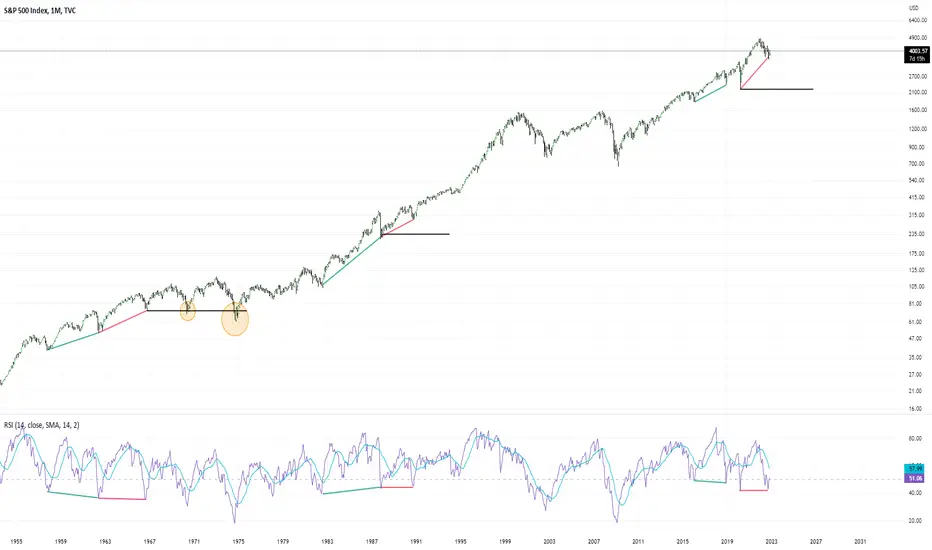
SPX Monthly Chart with momentum RSI MONTHLY - showing double bottom:
Formed in June of '62 & Aug '66. retested twice in May '70 and Oct '74. Rebounded and never looked back.
Formed Nov '87 & Oct '90. Price did not retest low.
Current March '20 & Sept 2022. Will price comes to retest the lows or never look back again?
Is the BOTTOM IN ? Is it over for the bear? Or still in a stage of Bear market Rallies?
 SPX
Formed in June of '62 & Aug '66. retested twice in May '70 and Oct '74. Rebounded and never looked back.
Formed Nov '87 & Oct '90. Price did not retest low.
Current March '20 & Sept 2022. Will price comes to retest the lows or never look back again?
Is the BOTTOM IN ? Is it over for the bear? Or still in a stage of Bear market Rallies?
SPX
Exención de responsabilidad
La información y las publicaciones no constituyen, ni deben considerarse como, asesoramiento o recomendaciones financieras, de inversión, de trading u otro tipo, proporcionadas o respaldadas por TradingView. Obtenga más información en Condiciones de uso.
Exención de responsabilidad
La información y las publicaciones no constituyen, ni deben considerarse como, asesoramiento o recomendaciones financieras, de inversión, de trading u otro tipo, proporcionadas o respaldadas por TradingView. Obtenga más información en Condiciones de uso.