

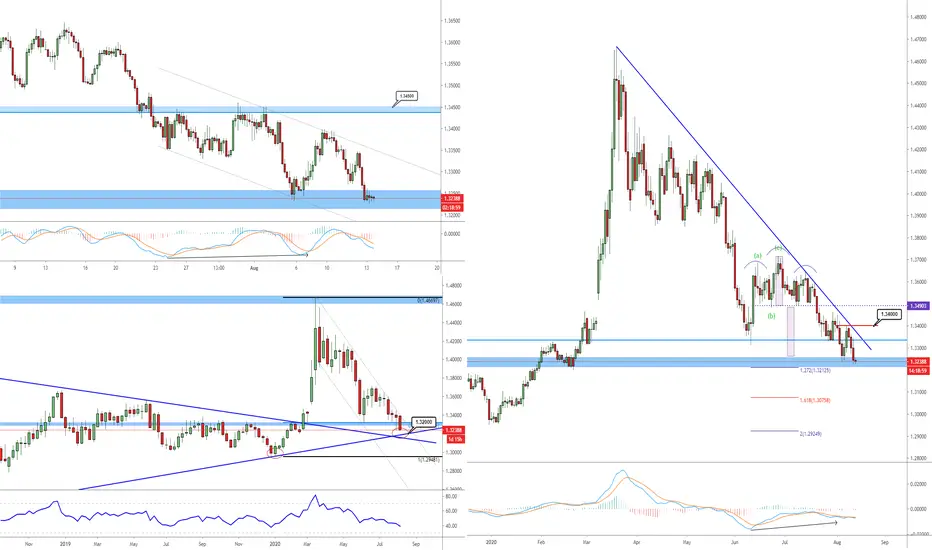
After almost 6 months of decline, we may see USD/CAD establish it's support level around the 1.3200 level.
Looking at the weekly timeframe, the price is currently at the confluence of multiple support level. A break below this level would mean a very bearish sign of the currency pair and would expose the 1.3000 level or much lower. On the daily timeframe, there is also a possibility that it will form a double bottom (bullish reversal) pattern. If today's session close with a bullish rejection candlestick that would be the first sign to watch for a possible reversal. Bullish divergence is also forming. Key resistance will come at 1.3400. A break above this level will most likely tell a reversal in trend is coming.
Looking at the weekly timeframe, the price is currently at the confluence of multiple support level. A break below this level would mean a very bearish sign of the currency pair and would expose the 1.3000 level or much lower. On the daily timeframe, there is also a possibility that it will form a double bottom (bullish reversal) pattern. If today's session close with a bullish rejection candlestick that would be the first sign to watch for a possible reversal. Bullish divergence is also forming. Key resistance will come at 1.3400. A break above this level will most likely tell a reversal in trend is coming.

Exención de responsabilidad
La información y las publicaciones no constituyen, ni deben considerarse como, asesoramiento o recomendaciones financieras, de inversión, de trading u otro tipo, proporcionadas o respaldadas por TradingView. Obtenga más información en Condiciones de uso.
Exención de responsabilidad
La información y las publicaciones no constituyen, ni deben considerarse como, asesoramiento o recomendaciones financieras, de inversión, de trading u otro tipo, proporcionadas o respaldadas por TradingView. Obtenga más información en Condiciones de uso.