

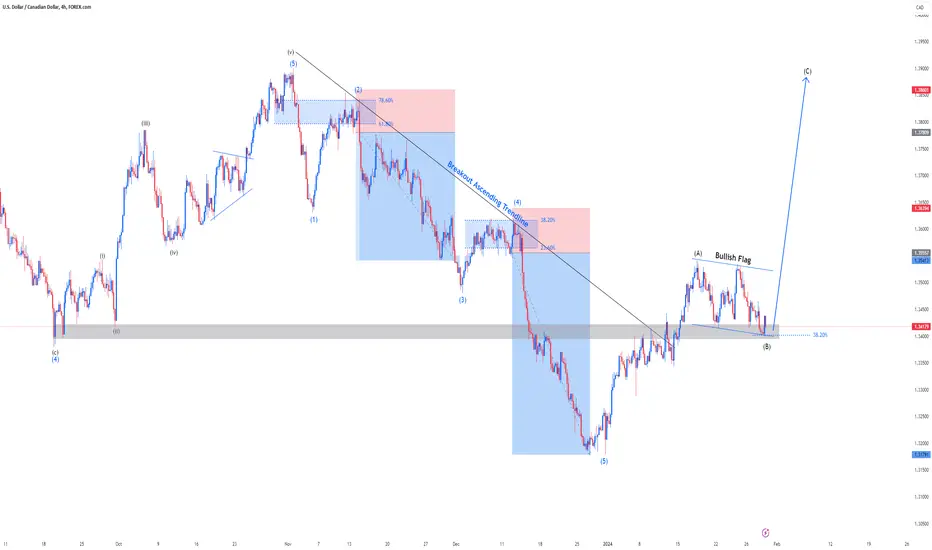
USDCAD is displaying a bullish trend on the 4-hour chart, supported by a breakout above the ascending trendline after completing the 5th wave. The current formation suggests a bullish pattern following a 38% retracement and adherence to an ABC wave structure. Consider potential long entries in anticipation of a continued upward trajectory in the market.

Exención de responsabilidad
La información y las publicaciones no constituyen, ni deben considerarse como, asesoramiento o recomendaciones financieras, de inversión, de trading u otro tipo, proporcionadas o respaldadas por TradingView. Obtenga más información en Condiciones de uso.
Exención de responsabilidad
La información y las publicaciones no constituyen, ni deben considerarse como, asesoramiento o recomendaciones financieras, de inversión, de trading u otro tipo, proporcionadas o respaldadas por TradingView. Obtenga más información en Condiciones de uso.