

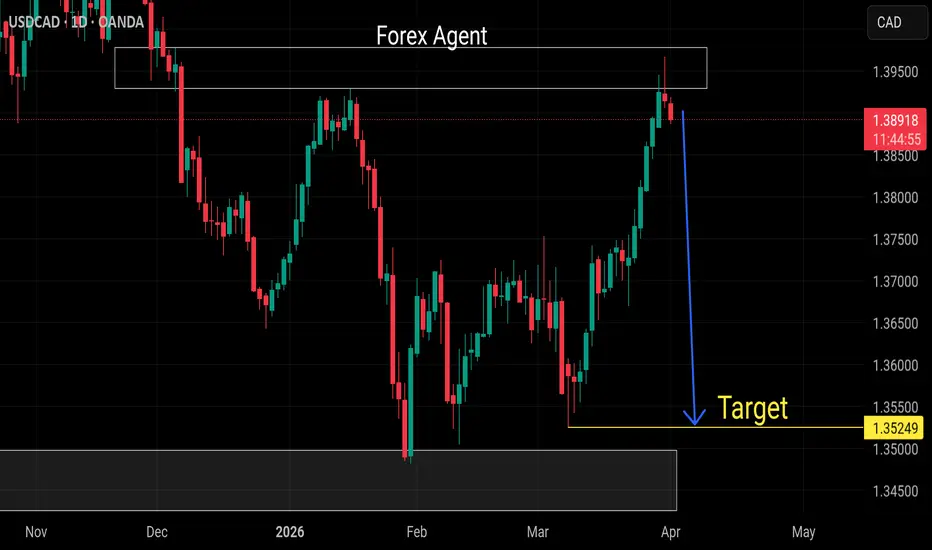
This USD/CAD daily chart highlights a decisive moment where the price has reached a multi-month resistance zone, often referred to as a "supply wall."
* Resistance Rejection: The price recently spiked into the 1.3900+ zone but immediately faced selling pressure, forming a bearish rejection wick.
* The Bearish Target: A clear downward projection is set toward 1.35249, which aligns with the significant swing lows established back in early March.
* Trend Shift: After a strong bullish rally throughout March, the current price action suggests momentum is stalling as it fails to break through the historical ceiling.
* Market Structure: The chart depicts a potential range-play strategy, where traders look to "sell the top" of the range in anticipation of a move back to the established floor.
* Risk Level: The setup remains valid as long as the resistance box holds; a daily close above 1.3950 would likely cancel this bearish "Target" outlook.
* Resistance Rejection: The price recently spiked into the 1.3900+ zone but immediately faced selling pressure, forming a bearish rejection wick.
* The Bearish Target: A clear downward projection is set toward 1.35249, which aligns with the significant swing lows established back in early March.
* Trend Shift: After a strong bullish rally throughout March, the current price action suggests momentum is stalling as it fails to break through the historical ceiling.
* Market Structure: The chart depicts a potential range-play strategy, where traders look to "sell the top" of the range in anticipation of a move back to the established floor.
* Risk Level: The setup remains valid as long as the resistance box holds; a daily close above 1.3950 would likely cancel this bearish "Target" outlook.

Exención de responsabilidad
La información y las publicaciones no constituyen, ni deben considerarse como, asesoramiento o recomendaciones financieras, de inversión, de trading u otro tipo, proporcionadas o respaldadas por TradingView. Obtenga más información en Condiciones de uso.
Exención de responsabilidad
La información y las publicaciones no constituyen, ni deben considerarse como, asesoramiento o recomendaciones financieras, de inversión, de trading u otro tipo, proporcionadas o respaldadas por TradingView. Obtenga más información en Condiciones de uso.