

USDCAD: 50% Fibonacci Level tested– Is Another Leg Lower Coming?
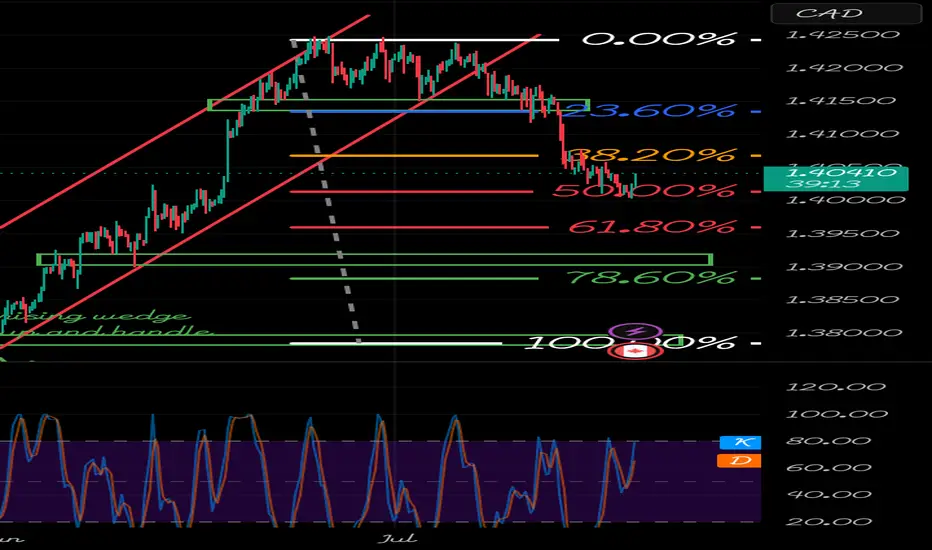
The sharp USD/CAD selloff that began after softer U.S. inflation data and resilient Canadian fundamentals has now reached another important technical decision point.
After breaking below the ascending channel and turning former support into resistance, price has continued respecting the bearish structure. The market is now consolidating around the 50% Fibonacci retracement, suggesting that sellers remain in control while buyers attempt to stabilize the decline.
From my perspective, the broader thesis remains intact: fundamentals are setting the direction, while technicals determine the timing.
Macro Picture
Last week provided several major catalysts:
• Softer U.S. CPI and PPI reduced expectations of aggressive Federal Reserve tightening.
• The Bank of Canada kept interest rates unchanged, citing economic uncertainty rather than signalling imminent easing.
• Canada's resilient labour market continues to provide underlying support for the Canadian dollar.
With those events now priced in, this week's focus shifts toward whether fresh data can validate the current trend or trigger a correction.
Technical Structure
The chart continues to respect bearish market structure.
Key observations:
Price remains below the broken ascending channel.
Previous support around 1.4140–1.4150 has become resistance.
The 38.2% Fibonacci level failed to hold.
Price is now consolidating around the 50% Fibonacci retracement near 1.4000.
The Stochastic RSI has recovered from oversold territory, indicating bearish momentum is slowing, but there is not yet a confirmed bullish reversal.
At this stage, the move looks more like bearish consolidation than trend exhaustion.
Levels I'm Watching
Resistance
1.4050 (38.2% Fibonacci)
1.4140–1.4150 (former support, now resistance)
Support
1.4000 (50% Fibonacci)
1.3950 (61.8% Fibonacci)
1.3900 (major historical support zone)
A sustained break below the 50% retracement would increase the probability of price extending toward the 61.8% Fibonacci level, where I expect stronger buying interest to emerge.
Trading Advantage™ Framework
USD/CAD Macro Score™ (UMS): 30/100 🔴
U.S. Dollar: Soft
Canadian Dollar: Supported
Technical Structure: Bearish
Overall Bias: Bearish
Market Risk Meter™ (MRM): 🟡 Moderate Markets are transitioning from reacting to last week's data toward positioning for the next macro catalysts, which may increase volatility as new information emerges.
My Trading Plan
I'm not interested in chasing price after an extended move lower.
Instead, I'll continue watching how price behaves around the current Fibonacci support. If sellers remain in control, the next objective becomes the 61.8% retracement. If buyers reclaim the 38.2% level and hold above it, that would be the first sign that a deeper correction may be developing.
As always, fundamentals provide the directional bias, while technical analysis determines the entries and exits.
The Trading Advantage™
"The highest-probability trades come from waiting for the market to confirm your thesis not from predicting every move."
After breaking below the ascending channel and turning former support into resistance, price has continued respecting the bearish structure. The market is now consolidating around the 50% Fibonacci retracement, suggesting that sellers remain in control while buyers attempt to stabilize the decline.
From my perspective, the broader thesis remains intact: fundamentals are setting the direction, while technicals determine the timing.
Macro Picture
Last week provided several major catalysts:
• Softer U.S. CPI and PPI reduced expectations of aggressive Federal Reserve tightening.
• The Bank of Canada kept interest rates unchanged, citing economic uncertainty rather than signalling imminent easing.
• Canada's resilient labour market continues to provide underlying support for the Canadian dollar.
With those events now priced in, this week's focus shifts toward whether fresh data can validate the current trend or trigger a correction.
Technical Structure
The chart continues to respect bearish market structure.
Key observations:
Price remains below the broken ascending channel.
Previous support around 1.4140–1.4150 has become resistance.
The 38.2% Fibonacci level failed to hold.
Price is now consolidating around the 50% Fibonacci retracement near 1.4000.
The Stochastic RSI has recovered from oversold territory, indicating bearish momentum is slowing, but there is not yet a confirmed bullish reversal.
At this stage, the move looks more like bearish consolidation than trend exhaustion.
Levels I'm Watching
Resistance
1.4050 (38.2% Fibonacci)
1.4140–1.4150 (former support, now resistance)
Support
1.4000 (50% Fibonacci)
1.3950 (61.8% Fibonacci)
1.3900 (major historical support zone)
A sustained break below the 50% retracement would increase the probability of price extending toward the 61.8% Fibonacci level, where I expect stronger buying interest to emerge.
Trading Advantage™ Framework
USD/CAD Macro Score™ (UMS): 30/100 🔴
U.S. Dollar: Soft
Canadian Dollar: Supported
Technical Structure: Bearish
Overall Bias: Bearish
Market Risk Meter™ (MRM): 🟡 Moderate Markets are transitioning from reacting to last week's data toward positioning for the next macro catalysts, which may increase volatility as new information emerges.
My Trading Plan
I'm not interested in chasing price after an extended move lower.
Instead, I'll continue watching how price behaves around the current Fibonacci support. If sellers remain in control, the next objective becomes the 61.8% retracement. If buyers reclaim the 38.2% level and hold above it, that would be the first sign that a deeper correction may be developing.
As always, fundamentals provide the directional bias, while technical analysis determines the entries and exits.
The Trading Advantage™
"The highest-probability trades come from waiting for the market to confirm your thesis not from predicting every move."

Exención de responsabilidad
La información y las publicaciones no constituyen, ni deben considerarse como, asesoramiento o recomendaciones financieras, de inversión, de trading u otro tipo, proporcionadas o respaldadas por TradingView. Obtenga más información en Condiciones de uso.
Exención de responsabilidad
La información y las publicaciones no constituyen, ni deben considerarse como, asesoramiento o recomendaciones financieras, de inversión, de trading u otro tipo, proporcionadas o respaldadas por TradingView. Obtenga más información en Condiciones de uso.