

USDCHF Bullish break of structure - analysis the week of 18 May
Recent price movements
The DXY had a strongly bullish week and looks set to continue.
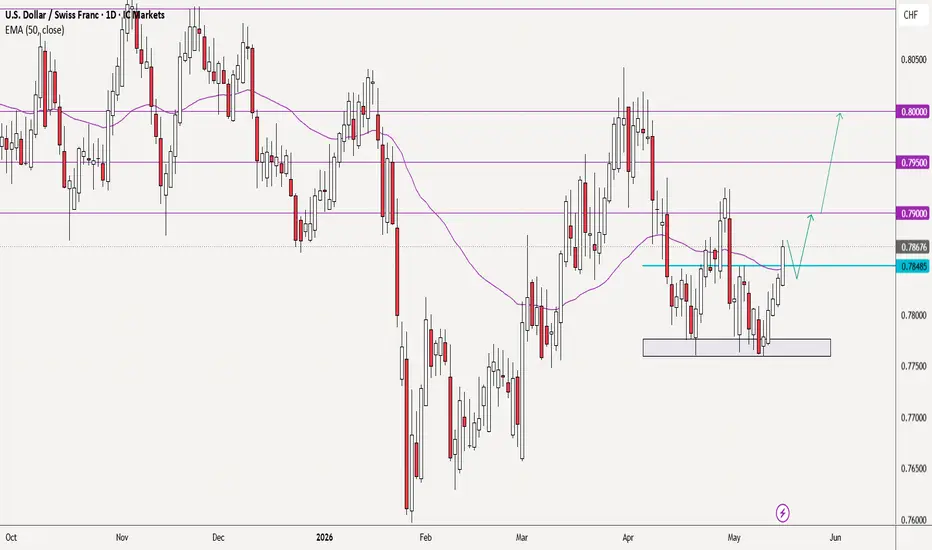
Looking at the daily chart of USDCHF, you will note the double bottom (0.7760-0.7777) and the recent break above 0.78485 that makes the pair bullish.
If we get a pull back and some bullish evidence on a lower t/f, I would be motivated to take a long.
Other time frames such as W1, H4 and H1 are all aligned to my bullish bias.
Note - USDCAD and USDJPY are also showing a similar structure.
Trade parameters
The current conflict in the world has created extra uncertainty and market manipulation. Trading with smaller position size and giving extra space for stops is recommended. Gaps are regularly seen and anticipating the market open and initial moves is impossible. However, the following scenario would make sense:
Entry – Upon seeing some evidence of a bullish continuation.
Stop – below a major swing low as seen on the H4 chart.
Target(s) – Depends on your trading style but I have marked a couple of options that could be considered (0.7950, 0.8000). I would stay flexible and remain open to taking profit and re-entering if price action confirms a continued move.
General comment
Nothing in trading is ever 100%, so please allow price action to fully develop in your desired direction before executing a trade.
This is not a trade recommendation
The DXY had a strongly bullish week and looks set to continue.
Looking at the daily chart of USDCHF, you will note the double bottom (0.7760-0.7777) and the recent break above 0.78485 that makes the pair bullish.
If we get a pull back and some bullish evidence on a lower t/f, I would be motivated to take a long.
Other time frames such as W1, H4 and H1 are all aligned to my bullish bias.
Note - USDCAD and USDJPY are also showing a similar structure.
Trade parameters
The current conflict in the world has created extra uncertainty and market manipulation. Trading with smaller position size and giving extra space for stops is recommended. Gaps are regularly seen and anticipating the market open and initial moves is impossible. However, the following scenario would make sense:
Entry – Upon seeing some evidence of a bullish continuation.
Stop – below a major swing low as seen on the H4 chart.
Target(s) – Depends on your trading style but I have marked a couple of options that could be considered (0.7950, 0.8000). I would stay flexible and remain open to taking profit and re-entering if price action confirms a continued move.
General comment
Nothing in trading is ever 100%, so please allow price action to fully develop in your desired direction before executing a trade.
This is not a trade recommendation
Operación activa
I hope you guys stayed patient as price moved in both directions yesterday. Now, we have a clear direction and 0.7900 area is not to far away. I intend to close 40-50% of my position there, move my stop to slightly above b/e and let this ride.
Exención de responsabilidad
La información y las publicaciones no constituyen, ni deben considerarse como, asesoramiento o recomendaciones financieras, de inversión, de trading u otro tipo, proporcionadas o respaldadas por TradingView. Obtenga más información en Condiciones de uso.
Exención de responsabilidad
La información y las publicaciones no constituyen, ni deben considerarse como, asesoramiento o recomendaciones financieras, de inversión, de trading u otro tipo, proporcionadas o respaldadas por TradingView. Obtenga más información en Condiciones de uso.