

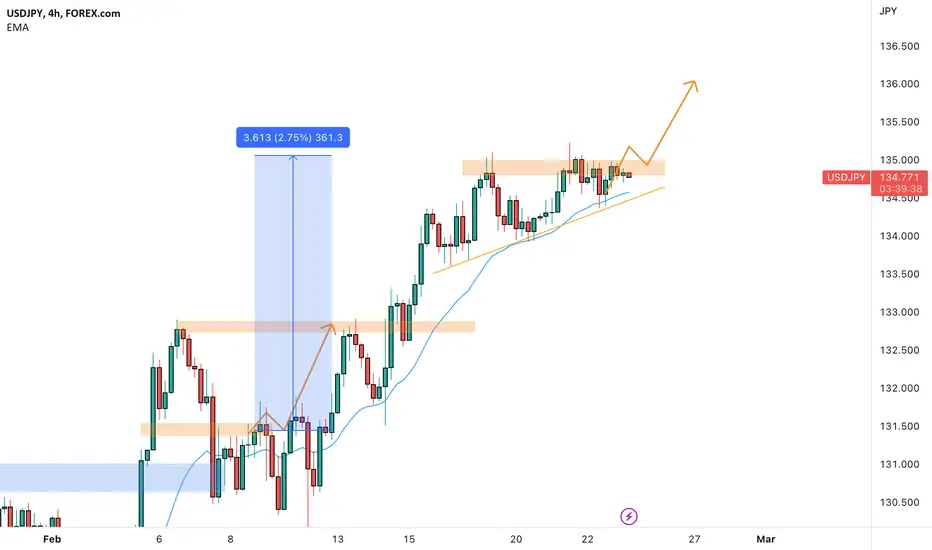
The USD/JPY pair has been in an uptrend for the past hours, with higher highs and higher lows. However, the price has started to consolidate and create equal highs and rising lows, indicating a potential formation of an ascending triangle pattern.
An ascending triangle is a bullish continuation pattern that typically forms during an uptrend. It consists of a horizontal resistance level and a rising trendline support. Traders often view this pattern as a bullish signal because buyers are willing to push the price higher and absorb any selling pressure near the resistance level.
Traders usually wait for a breakout confirmation to enter into a long position. A breakout occurs when the price breaks above the horizontal resistance level with a significant increase in volume. This breakout confirms that buyers have taken control of the market and that the uptrend is likely to continue.
Based on the above analysis, traders can wait for a potential breakout above the horizontal resistance level of the ascending triangle pattern to confirm the uptrend continuation according to the Plancton's strategy rules.
An ascending triangle is a bullish continuation pattern that typically forms during an uptrend. It consists of a horizontal resistance level and a rising trendline support. Traders often view this pattern as a bullish signal because buyers are willing to push the price higher and absorb any selling pressure near the resistance level.
Traders usually wait for a breakout confirmation to enter into a long position. A breakout occurs when the price breaks above the horizontal resistance level with a significant increase in volume. This breakout confirms that buyers have taken control of the market and that the uptrend is likely to continue.
Based on the above analysis, traders can wait for a potential breakout above the horizontal resistance level of the ascending triangle pattern to confirm the uptrend continuation according to the Plancton's strategy rules.
Nota
Nota
Nota
Nota
Nota

Exención de responsabilidad
La información y las publicaciones no constituyen, ni deben considerarse como, asesoramiento o recomendaciones financieras, de inversión, de trading u otro tipo, proporcionadas o respaldadas por TradingView. Obtenga más información en Condiciones de uso.
Exención de responsabilidad
La información y las publicaciones no constituyen, ni deben considerarse como, asesoramiento o recomendaciones financieras, de inversión, de trading u otro tipo, proporcionadas o respaldadas por TradingView. Obtenga más información en Condiciones de uso.