
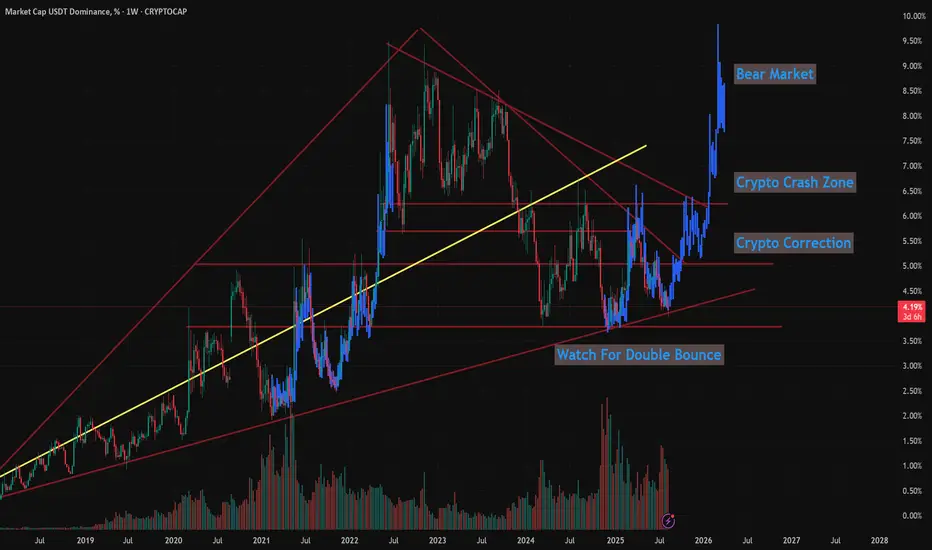
Just a quick update on this study, as boring as it may seem to some...
This continues to reveal clues, and while it's not a leading indicator necessarily -- But it's very interesting that this trendline has held since 2018 and last night when Bitcoin and the Total Market Cap was rallying -- USDT.D was breaking down below the trendline for the 1st time...
I made a comment in a video, that if this breaks below on a closing basis -- We'd see a massive rally in Bitcoin.. BUT that maybe it was a signal that Bitcoin was overbought and would revert.
And that's what happened. Interesting.
So the trendline held.
For those new to this study, this shows the inverse relationship between stabledoins and crypto.
Obviously, money flowing into one comes out of the other.
So when markets rally and bull markets are peaking, USDT.D flows are at their lowest.
When USDT.D (as a surrogate for stablecoins) rallies, money is flowing out of Bitcoin and crypto as a whole, so Total Market Cap and crypto as a whole is selling off.
That's why I'm watching this chart carefully.
And while USDT.D can stay just above this lower rising trendline for weeks, ultimately it breaks to the upside and signals corrective phases, as well as crashes above certain levels.
TLDR: We have limited time to push to new ATH's and hit $150k as we're expecting, before a correction and HOPEFULLY we get one more cycle push to $200k.
The Blue fractal from 2021 would suggest otherwise, so we should keep that in mind.
Let me know what you think in the comments below.
- Brett
This continues to reveal clues, and while it's not a leading indicator necessarily -- But it's very interesting that this trendline has held since 2018 and last night when Bitcoin and the Total Market Cap was rallying -- USDT.D was breaking down below the trendline for the 1st time...
I made a comment in a video, that if this breaks below on a closing basis -- We'd see a massive rally in Bitcoin.. BUT that maybe it was a signal that Bitcoin was overbought and would revert.
And that's what happened. Interesting.
So the trendline held.
For those new to this study, this shows the inverse relationship between stabledoins and crypto.
Obviously, money flowing into one comes out of the other.
So when markets rally and bull markets are peaking, USDT.D flows are at their lowest.
When USDT.D (as a surrogate for stablecoins) rallies, money is flowing out of Bitcoin and crypto as a whole, so Total Market Cap and crypto as a whole is selling off.
That's why I'm watching this chart carefully.
And while USDT.D can stay just above this lower rising trendline for weeks, ultimately it breaks to the upside and signals corrective phases, as well as crashes above certain levels.
TLDR: We have limited time to push to new ATH's and hit $150k as we're expecting, before a correction and HOPEFULLY we get one more cycle push to $200k.
The Blue fractal from 2021 would suggest otherwise, so we should keep that in mind.
Let me know what you think in the comments below.
- Brett

25-year investor & trader, bought 1st BTC at $20
More information:
Work With Me 1:1
moonstreamcoaching.com
Trading Signals: CryptoMastery.org
M3 Active Trader: Moonstream.io/M3
More information:
Work With Me 1:1
moonstreamcoaching.com
Trading Signals: CryptoMastery.org
M3 Active Trader: Moonstream.io/M3
Publicaciones relacionadas
Exención de responsabilidad
La información y las publicaciones no constituyen, ni deben considerarse como, asesoramiento o recomendaciones financieras, de inversión, de trading u otro tipo, proporcionadas o respaldadas por TradingView. Obtenga más información en Condiciones de uso.
25-year investor & trader, bought 1st BTC at $20
More information:
Work With Me 1:1
moonstreamcoaching.com
Trading Signals: CryptoMastery.org
M3 Active Trader: Moonstream.io/M3
More information:
Work With Me 1:1
moonstreamcoaching.com
Trading Signals: CryptoMastery.org
M3 Active Trader: Moonstream.io/M3
Publicaciones relacionadas
Exención de responsabilidad
La información y las publicaciones no constituyen, ni deben considerarse como, asesoramiento o recomendaciones financieras, de inversión, de trading u otro tipo, proporcionadas o respaldadas por TradingView. Obtenga más información en Condiciones de uso.