

Unum flash note on the USDZAR from our Trading Desk analyst, Lester Davids.
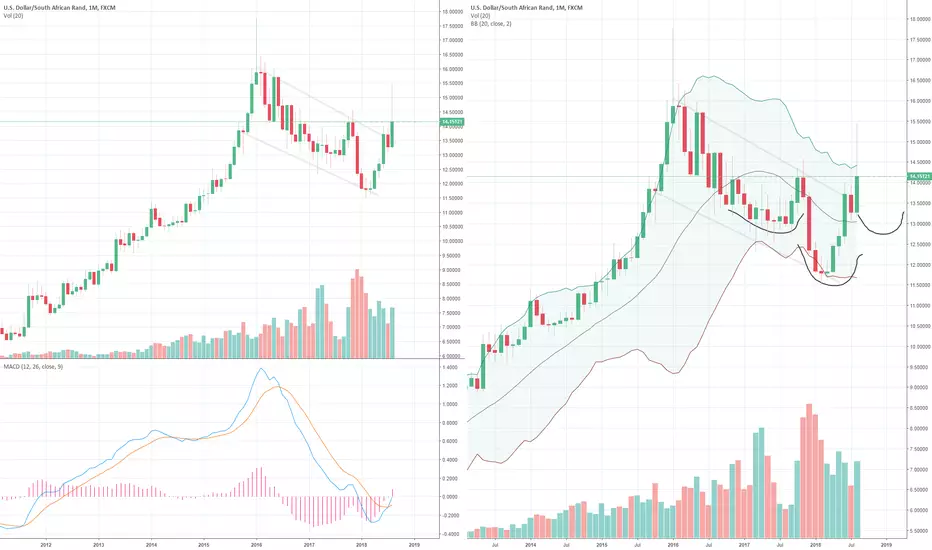
Chart 1: USDZAR: We currently trade just below the R14.25 resistance, with the Rand having gained on a weaker USD. The monthly chart shows this to be the top of the bull flag/channel.
Chart 2: Another view (again the monthly chart), shows the potential start of a "right shoulder" of a long term inverse H&S formation.
support and resistance levels from the bank analysts (Investec) this morning confirm these ranges (R1 14.2430, S1 14.15)
Chart 1: USDZAR: We currently trade just below the R14.25 resistance, with the Rand having gained on a weaker USD. The monthly chart shows this to be the top of the bull flag/channel.
Chart 2: Another view (again the monthly chart), shows the potential start of a "right shoulder" of a long term inverse H&S formation.
support and resistance levels from the bank analysts (Investec) this morning confirm these ranges (R1 14.2430, S1 14.15)

Exención de responsabilidad
La información y las publicaciones no constituyen, ni deben considerarse como, asesoramiento o recomendaciones financieras, de inversión, de trading u otro tipo, proporcionadas o respaldadas por TradingView. Obtenga más información en Condiciones de uso.
Exención de responsabilidad
La información y las publicaciones no constituyen, ni deben considerarse como, asesoramiento o recomendaciones financieras, de inversión, de trading u otro tipo, proporcionadas o respaldadas por TradingView. Obtenga más información en Condiciones de uso.