
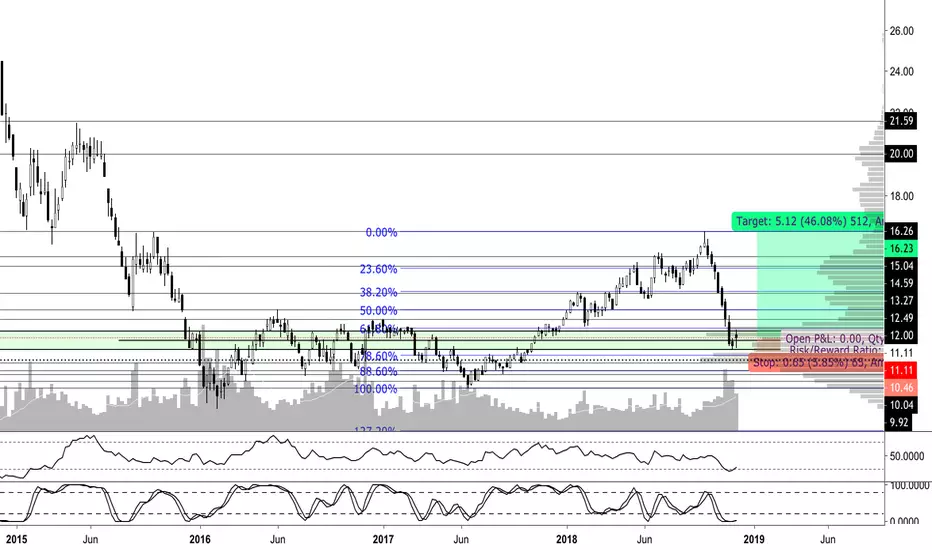
RSI+ROC have not been this low since early 2015/late 2014
Forming reversal candles on the weekly chart
SRSI and RSI+ROC are starting to curl up
Horizontals marked are the S/R levels to watch for possible rejections and bounces
Prices of each level are on the right side of the chart
----------------------------------------------------------------------
Possible trade for USO
Buy $11.11
Stop loss $10.46
Ultimate target $16.26

Exención de responsabilidad
La información y las publicaciones no constituyen, ni deben considerarse como, asesoramiento o recomendaciones financieras, de inversión, de trading u otro tipo, proporcionadas o respaldadas por TradingView. Obtenga más información en Condiciones de uso.
Exención de responsabilidad
La información y las publicaciones no constituyen, ni deben considerarse como, asesoramiento o recomendaciones financieras, de inversión, de trading u otro tipo, proporcionadas o respaldadas por TradingView. Obtenga más información en Condiciones de uso.