
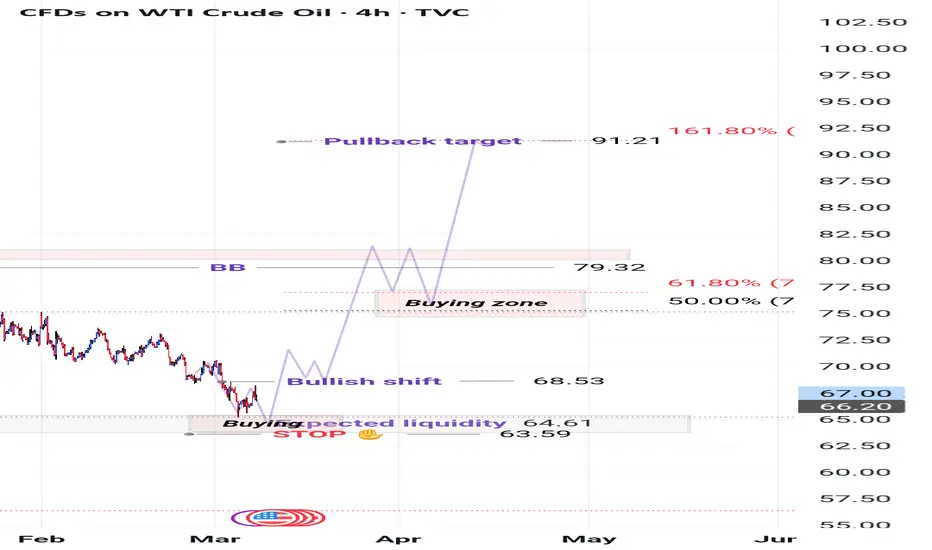
This chart is focused on short-term ICT analysis, showing liquidity zones, displacement, and market structure shifts.
1. Smart Money Liquidity Grab at 63.59-64.61
This is an Expected Liquidity Pool.
ICT concepts suggest that institutions often engineer liquidity grabs at key support levels before reversing.
The area around 64.61 is a sell-side liquidity sweep, designed to trap retail shorts before Smart Money initiates a bullish move.
2. Market Structure Shift (MSS) at 68.53
A break above 68.53 is a bullish shift, signaling a change in trend.
Displacement with a fair value gap (FVG) around 68.53 confirms momentum.
If price reclaims 68.53, expect Smart Money to target buy-side liquidity at 79.32 and later 91.21.
3. Buying Zone & Smart Money Accumulation (75-77 Range)
Once price reaches 79.32, expect a retracement into the 75-77 range, allowing Smart Money to re-accumulate.
A break above 91.21 unlocks the potential for higher moves, aligning with the higher time frame Elliott Wave 5 targets.
1. Smart Money Liquidity Grab at 63.59-64.61
This is an Expected Liquidity Pool.
ICT concepts suggest that institutions often engineer liquidity grabs at key support levels before reversing.
The area around 64.61 is a sell-side liquidity sweep, designed to trap retail shorts before Smart Money initiates a bullish move.
2. Market Structure Shift (MSS) at 68.53
A break above 68.53 is a bullish shift, signaling a change in trend.
Displacement with a fair value gap (FVG) around 68.53 confirms momentum.
If price reclaims 68.53, expect Smart Money to target buy-side liquidity at 79.32 and later 91.21.
3. Buying Zone & Smart Money Accumulation (75-77 Range)
Once price reaches 79.32, expect a retracement into the 75-77 range, allowing Smart Money to re-accumulate.
A break above 91.21 unlocks the potential for higher moves, aligning with the higher time frame Elliott Wave 5 targets.

Exención de responsabilidad
La información y las publicaciones no constituyen, ni deben considerarse como, asesoramiento o recomendaciones financieras, de inversión, de trading u otro tipo, proporcionadas o respaldadas por TradingView. Obtenga más información en Condiciones de uso.
Exención de responsabilidad
La información y las publicaciones no constituyen, ni deben considerarse como, asesoramiento o recomendaciones financieras, de inversión, de trading u otro tipo, proporcionadas o respaldadas por TradingView. Obtenga más información en Condiciones de uso.