
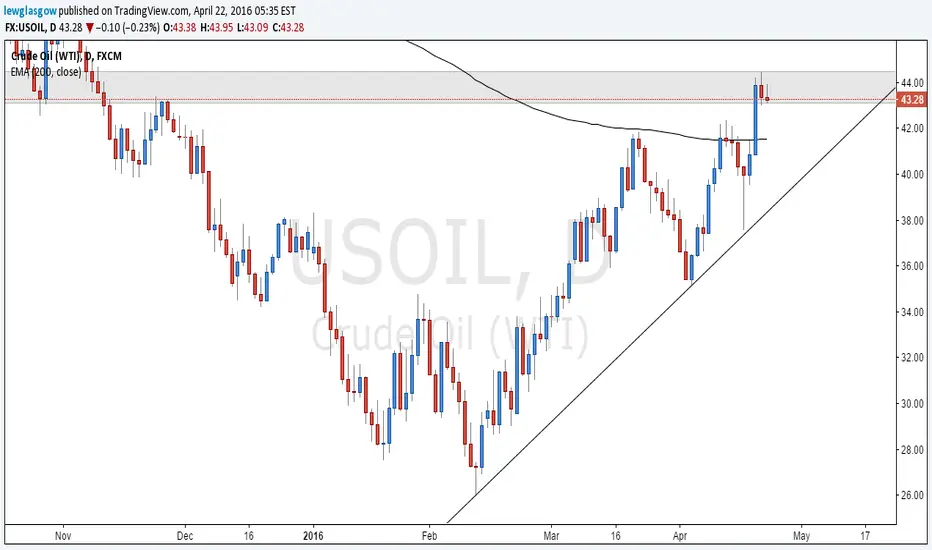
Once again we are looking at USOIL on a Daily chart with a potential shorting opportunity. I'm loving the look of this, you can see we have tested a major turning point in the market which has provided us with our future price direction.
We can clearly see that whenever price gets relatively close to our 200 EMA it changes direction very quickly, I can see price going short all the way down to our trendline and meeting our indicator in the same area.
We can clearly see that whenever price gets relatively close to our 200 EMA it changes direction very quickly, I can see price going short all the way down to our trendline and meeting our indicator in the same area.

📈 Master the Art and Science of Trading: sixfigurecapital.com
Publicaciones relacionadas
Exención de responsabilidad
La información y las publicaciones no constituyen, ni deben considerarse como, asesoramiento o recomendaciones financieras, de inversión, de trading u otro tipo, proporcionadas o respaldadas por TradingView. Obtenga más información en Condiciones de uso.