
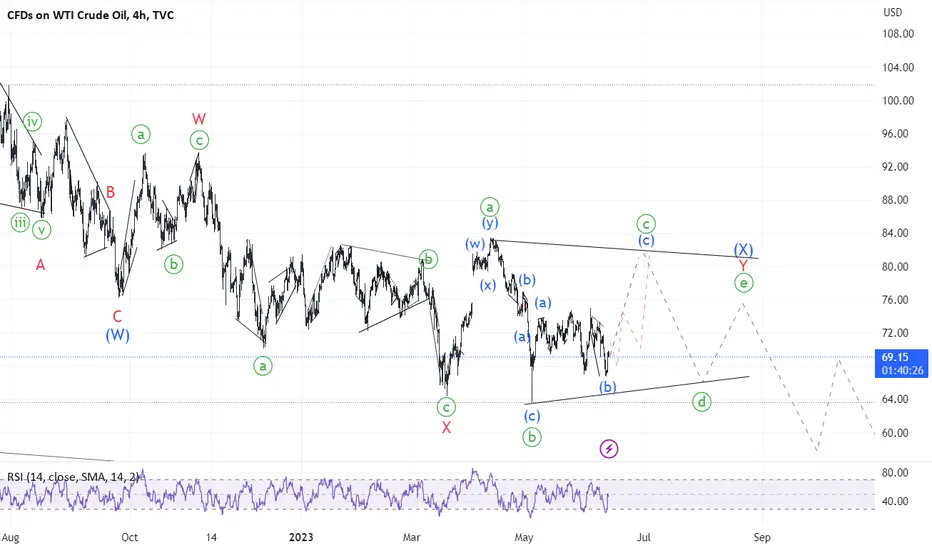
I think I just decoded the oil chart. I have been contemplating a rise to $90+ because I expected ABC flat where I now see WXY combination of zigzag, zigzag and triangle. The chart now perfectly aligns with Brent where wave [[]B] did make lowest low presumably shaping a symmetrical triangle whereas WTI is working on a running triangle.
That means that we have only strong push left upwards from current low which should come either as a straight impulse or an expanding diagonal which will be extremely annoying.
That means that we have only strong push left upwards from current low which should come either as a straight impulse or an expanding diagonal which will be extremely annoying.

Publicaciones relacionadas
Exención de responsabilidad
La información y las publicaciones no constituyen, ni deben considerarse como, asesoramiento o recomendaciones financieras, de inversión, de trading u otro tipo, proporcionadas o respaldadas por TradingView. Obtenga más información en Condiciones de uso.
Publicaciones relacionadas
Exención de responsabilidad
La información y las publicaciones no constituyen, ni deben considerarse como, asesoramiento o recomendaciones financieras, de inversión, de trading u otro tipo, proporcionadas o respaldadas por TradingView. Obtenga más información en Condiciones de uso.