
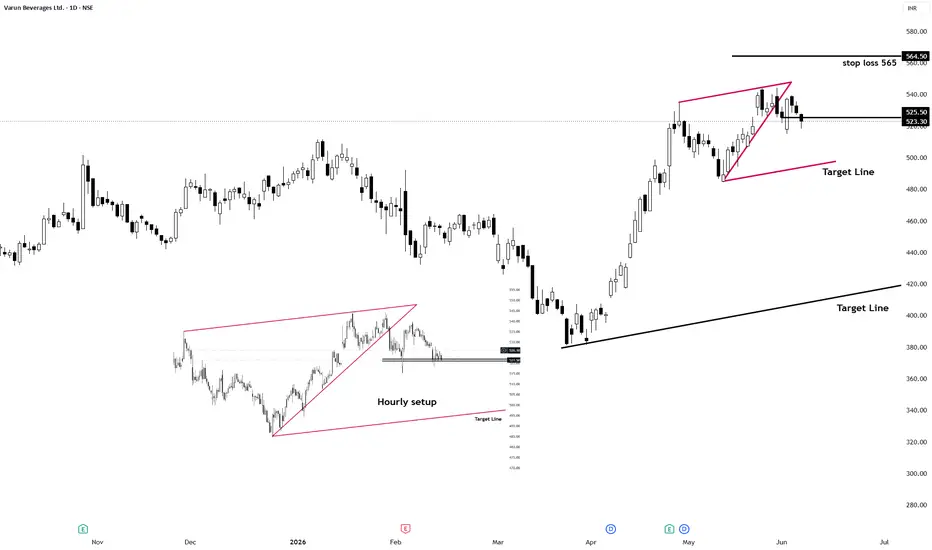
# Varun Beverages Ltd. (NSE: VBL) – Bearish Rising Wedge Setup
VBL has witnessed a sharp rally from the April lows, but recent price action suggests that momentum may be weakening near the higher levels.
### Technical Observation
The stock appears to be forming a **rising wedge pattern**, a structure that often develops near the end of an uptrend and can signal a potential reversal if support breaks.
A similar setup was observed on the hourly timeframe (shown in the inset), where price eventually broke down from the wedge and moved toward the projected downside target.
### Current Structure
* Price is trading within converging rising trendlines.
* Multiple rejections near the upper boundary indicate slowing bullish momentum.
* The ₹523 zone represents an important support level and the lower boundary of the pattern.
* A breakdown below this level could trigger increased selling pressure.
### Key Levels
📌 **Breakdown Trigger:** ₹523
📌 **Stop Loss:** ₹565
📌 **Downside Target:** As projected by the wedge measurement and illustrated by the target trendline on the chart.
### Trading Plan
**Bearish Scenario**
* A decisive close below ₹523 may confirm the wedge breakdown.
* Once the breakdown is confirmed, the stock could move toward lower support levels and eventually the projected target zone.
**Invalidation**
* Any strong move above ₹565 would invalidate the bearish setup and suggest buyers have regained control.
### Market Psychology
Rising wedges often indicate that prices are still moving higher, but each advance is becoming less effective. As buying momentum fades, a break below support can lead to a sharper corrective move as traders begin to book profits.
### Conclusion
VBL remains at a critical juncture. The rising wedge structure and weakening momentum suggest caution for bulls. A confirmed breakdown below ₹523 could open the door for a deeper correction, while a move above ₹565 would negate the bearish thesis.
**Levels to Watch**
🔻 Breakdown Level: ₹523
🔻 Bearish Target: As marked on chart
🔻 Stop Loss: ₹565
🔻 Bias: Bearish Below ₹523
**Disclaimer:** This analysis is for educational purposes only and should not be considered financial advice. Always use proper risk management and conduct your own research before taking any trade.
VBL has witnessed a sharp rally from the April lows, but recent price action suggests that momentum may be weakening near the higher levels.
### Technical Observation
The stock appears to be forming a **rising wedge pattern**, a structure that often develops near the end of an uptrend and can signal a potential reversal if support breaks.
A similar setup was observed on the hourly timeframe (shown in the inset), where price eventually broke down from the wedge and moved toward the projected downside target.
### Current Structure
* Price is trading within converging rising trendlines.
* Multiple rejections near the upper boundary indicate slowing bullish momentum.
* The ₹523 zone represents an important support level and the lower boundary of the pattern.
* A breakdown below this level could trigger increased selling pressure.
### Key Levels
📌 **Breakdown Trigger:** ₹523
📌 **Stop Loss:** ₹565
📌 **Downside Target:** As projected by the wedge measurement and illustrated by the target trendline on the chart.
### Trading Plan
**Bearish Scenario**
* A decisive close below ₹523 may confirm the wedge breakdown.
* Once the breakdown is confirmed, the stock could move toward lower support levels and eventually the projected target zone.
**Invalidation**
* Any strong move above ₹565 would invalidate the bearish setup and suggest buyers have regained control.
### Market Psychology
Rising wedges often indicate that prices are still moving higher, but each advance is becoming less effective. As buying momentum fades, a break below support can lead to a sharper corrective move as traders begin to book profits.
### Conclusion
VBL remains at a critical juncture. The rising wedge structure and weakening momentum suggest caution for bulls. A confirmed breakdown below ₹523 could open the door for a deeper correction, while a move above ₹565 would negate the bearish thesis.
**Levels to Watch**
🔻 Breakdown Level: ₹523
🔻 Bearish Target: As marked on chart
🔻 Stop Loss: ₹565
🔻 Bias: Bearish Below ₹523
**Disclaimer:** This analysis is for educational purposes only and should not be considered financial advice. Always use proper risk management and conduct your own research before taking any trade.
Nota
huge profit running Nota
total 11 % fall after my this post without hitting stop lossNota
from 525 to 425 around 20% profit doneOperación cerrada: objetivo alcanzado

Publicaciones relacionadas
Exención de responsabilidad
La información y las publicaciones no constituyen, ni deben considerarse como, asesoramiento o recomendaciones financieras, de inversión, de trading u otro tipo, proporcionadas o respaldadas por TradingView. Obtenga más información en Condiciones de uso.
Publicaciones relacionadas
Exención de responsabilidad
La información y las publicaciones no constituyen, ni deben considerarse como, asesoramiento o recomendaciones financieras, de inversión, de trading u otro tipo, proporcionadas o respaldadas por TradingView. Obtenga más información en Condiciones de uso.