
ANALYSIS
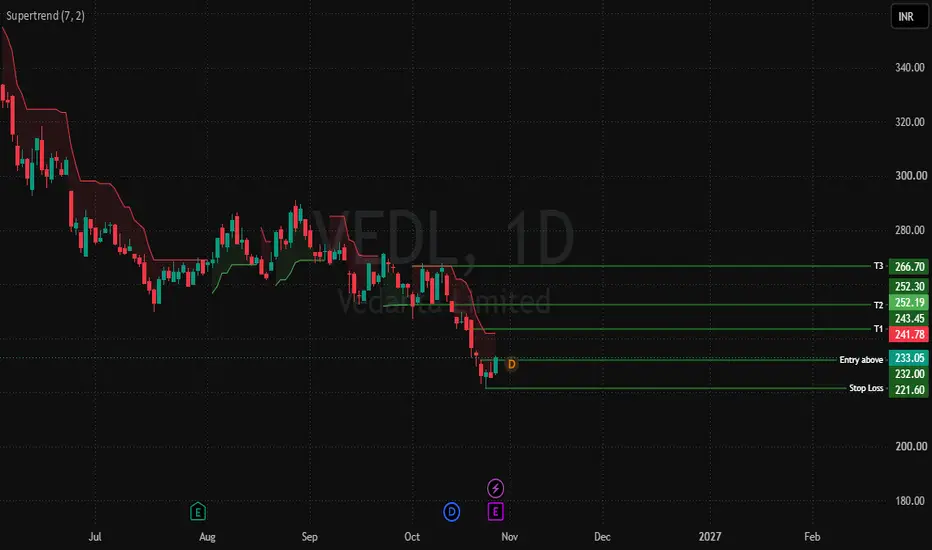
VEDANTA LTD. (VEDL) is approaching a potential bullish swing breakout above the recent high of ₹232.75.
The proposed setup requires a decisive daily candle close above ₹233.00, followed by a successful retest of the breakout zone.
The chart snapshot shows a recent high of ₹232.75 and a low of ₹226.40, defining the immediate price structure.
The displayed Supertrend is near ₹241.78, indicating a potential overhead resistance zone that price must overcome.
A sustained move above ₹233.00 could open the way toward the proposed targets at ₹241.80, ₹250.00 and ₹258.00.
The setup remains conditional until the breakout is confirmed. An intraday move above resistance without a daily close is insufficient confirmation.
Risk Observation: Rejection near ₹233.00 could lead to further consolidation. A breakdown below ₹226.40 before entry would invalidate the proposed setup.
KEY TECHNICAL LEVELS
Recent High: ₹232.75
Breakout Confirmation: ₹233.00
Indicative Entry Zone: ₹233.00–₹234.00
Supertrend Resistance: ₹241.78
Recent Low: ₹226.40
MAJOR MOMENTUM SIGNAL
A daily close above ₹233.00 would indicate a potential breakout from the recent price range.
A successful retest of ₹232.75–₹233.00 would strengthen the breakout structure.
The Supertrend near ₹241.78 represents an important decision zone for further bullish continuation.
Sustained price action above ₹242.00 would improve the possibility of a move toward ₹250.00.
Breakout volume and follow-through should be monitored before assuming a sustained bullish trend.
FUNDAMENTAL CONTEXT
Vedanta's September-quarter production update reported growth across several operating segments.
Zinc India mined-metal production was reported at 271,000 tonnes, while refined lead production increased 14% year on year.
Silver production increased 20% year on year to 173 tonnes.
Zinc International production increased 9% quarter on quarter to 53,000 tonnes.
Ferrochrome production increased 26% to 24,000 tonnes.
These operational figures provide context but do not independently confirm improved profitability, cash flow or consolidated earnings.
Verify the Q2 FY27 financial results and the market's reaction before treating the earnings announcement as a bullish catalyst.
TRADE PLAN
Entry Trigger: Daily candle close above ₹233.00, preferably followed by a successful retest.
Indicative Entry Zone: ₹233.00–₹234.00
Stop Loss: ₹225.90
Target 1: ₹241.80
Target 2: ₹250.00
Target 3: ₹258.00
Trade Management: Wait for daily candle-close confirmation. Avoid chasing a sharp gap-up or an extended move above the entry zone. Consider partial profit booking near ₹241.00–₹242.00, where the displayed Supertrend may act as resistance. Retain the remaining position only if price breaks through this zone convincingly. Reassess the setup if the breakout fails or the price structure deteriorates.
RISK–REWARD ANALYSIS
Entry Reference: ₹233.50
Stop Loss: ₹225.90
Risk per Share: ₹7.60
Target 1 Reward: ₹8.30 — approximately 1:1.09 risk–reward
Target 2 Reward: ₹16.50 — approximately 1:2.17 risk–reward
Target 3 Reward: ₹24.50 — approximately 1:3.22 risk–reward
Risk–reward calculations use ₹233.50 as the entry reference. Actual results will vary with the execution price, brokerage, slippage and stop-loss execution. Earnings-related price gaps may result in losses exceeding the planned risk.
BULLISH BREAKOUT SEQUENCE
₹226.40 Recent Low → ₹232.75 Recent High → ₹233.00 Breakout → ₹241.80 → ₹250.00 → ₹258.00
A break below ₹226.40 before entry invalidates the proposed setup.
A daily close above ₹233.00 followed by a successful retest strengthens the bullish case.
The ₹241.00–₹242.00 zone is the first major decision point because of the displayed Supertrend.
Sustained follow-through above ₹242.00 is needed to improve the case for higher targets.
ANALYTICS VERDICT
Stock: VEDL — Vedanta Ltd.
Exchange: NSE
Timeframe: Daily (1D)
Setup: Conditional bullish swing breakout
Recent High: ₹232.75
Entry Trigger: Daily close above ₹233.00
Indicative Entry: ₹233.00–₹234.00
Stop Loss: ₹225.90
Target 1: ₹241.80
Target 2: ₹250.00
Target 3: ₹258.00
Setup Invalidation: Breakdown below ₹226.40 before entry
Key Resistance: ₹241.00–₹242.00
Final confirmation: VEDL is developing a potential bullish swing setup above ₹233.00. A decisive daily close above the breakout level, followed by a successful retest and sustained momentum, would strengthen the case for a move toward ₹241.80, ₹250.00 and ₹258.00. The nearby Supertrend resistance and earnings-related volatility warrant disciplined risk management.
#VEDL #Vedanta #NSE #SwingTrading #Breakout #Supertrend #TechnicalAnalysis #PriceAction #StockMarketIndia
For education and research only. Not financial advice. DYOR.
Disclaimer: aliceblueonline.com/legal-documentation/disclaimer
VEDANTA LTD. (VEDL) is approaching a potential bullish swing breakout above the recent high of ₹232.75.
The proposed setup requires a decisive daily candle close above ₹233.00, followed by a successful retest of the breakout zone.
The chart snapshot shows a recent high of ₹232.75 and a low of ₹226.40, defining the immediate price structure.
The displayed Supertrend is near ₹241.78, indicating a potential overhead resistance zone that price must overcome.
A sustained move above ₹233.00 could open the way toward the proposed targets at ₹241.80, ₹250.00 and ₹258.00.
The setup remains conditional until the breakout is confirmed. An intraday move above resistance without a daily close is insufficient confirmation.
Risk Observation: Rejection near ₹233.00 could lead to further consolidation. A breakdown below ₹226.40 before entry would invalidate the proposed setup.
KEY TECHNICAL LEVELS
Recent High: ₹232.75
Breakout Confirmation: ₹233.00
Indicative Entry Zone: ₹233.00–₹234.00
Supertrend Resistance: ₹241.78
Recent Low: ₹226.40
MAJOR MOMENTUM SIGNAL
A daily close above ₹233.00 would indicate a potential breakout from the recent price range.
A successful retest of ₹232.75–₹233.00 would strengthen the breakout structure.
The Supertrend near ₹241.78 represents an important decision zone for further bullish continuation.
Sustained price action above ₹242.00 would improve the possibility of a move toward ₹250.00.
Breakout volume and follow-through should be monitored before assuming a sustained bullish trend.
FUNDAMENTAL CONTEXT
Vedanta's September-quarter production update reported growth across several operating segments.
Zinc India mined-metal production was reported at 271,000 tonnes, while refined lead production increased 14% year on year.
Silver production increased 20% year on year to 173 tonnes.
Zinc International production increased 9% quarter on quarter to 53,000 tonnes.
Ferrochrome production increased 26% to 24,000 tonnes.
These operational figures provide context but do not independently confirm improved profitability, cash flow or consolidated earnings.
Verify the Q2 FY27 financial results and the market's reaction before treating the earnings announcement as a bullish catalyst.
TRADE PLAN
Entry Trigger: Daily candle close above ₹233.00, preferably followed by a successful retest.
Indicative Entry Zone: ₹233.00–₹234.00
Stop Loss: ₹225.90
Target 1: ₹241.80
Target 2: ₹250.00
Target 3: ₹258.00
Trade Management: Wait for daily candle-close confirmation. Avoid chasing a sharp gap-up or an extended move above the entry zone. Consider partial profit booking near ₹241.00–₹242.00, where the displayed Supertrend may act as resistance. Retain the remaining position only if price breaks through this zone convincingly. Reassess the setup if the breakout fails or the price structure deteriorates.
RISK–REWARD ANALYSIS
Entry Reference: ₹233.50
Stop Loss: ₹225.90
Risk per Share: ₹7.60
Target 1 Reward: ₹8.30 — approximately 1:1.09 risk–reward
Target 2 Reward: ₹16.50 — approximately 1:2.17 risk–reward
Target 3 Reward: ₹24.50 — approximately 1:3.22 risk–reward
Risk–reward calculations use ₹233.50 as the entry reference. Actual results will vary with the execution price, brokerage, slippage and stop-loss execution. Earnings-related price gaps may result in losses exceeding the planned risk.
BULLISH BREAKOUT SEQUENCE
₹226.40 Recent Low → ₹232.75 Recent High → ₹233.00 Breakout → ₹241.80 → ₹250.00 → ₹258.00
A break below ₹226.40 before entry invalidates the proposed setup.
A daily close above ₹233.00 followed by a successful retest strengthens the bullish case.
The ₹241.00–₹242.00 zone is the first major decision point because of the displayed Supertrend.
Sustained follow-through above ₹242.00 is needed to improve the case for higher targets.
ANALYTICS VERDICT
Stock: VEDL — Vedanta Ltd.
Exchange: NSE
Timeframe: Daily (1D)
Setup: Conditional bullish swing breakout
Recent High: ₹232.75
Entry Trigger: Daily close above ₹233.00
Indicative Entry: ₹233.00–₹234.00
Stop Loss: ₹225.90
Target 1: ₹241.80
Target 2: ₹250.00
Target 3: ₹258.00
Setup Invalidation: Breakdown below ₹226.40 before entry
Key Resistance: ₹241.00–₹242.00
Final confirmation: VEDL is developing a potential bullish swing setup above ₹233.00. A decisive daily close above the breakout level, followed by a successful retest and sustained momentum, would strengthen the case for a move toward ₹241.80, ₹250.00 and ₹258.00. The nearby Supertrend resistance and earnings-related volatility warrant disciplined risk management.
#VEDL #Vedanta #NSE #SwingTrading #Breakout #Supertrend #TechnicalAnalysis #PriceAction #StockMarketIndia
For education and research only. Not financial advice. DYOR.
Disclaimer: aliceblueonline.com/legal-documentation/disclaimer

Exención de responsabilidad
La información y las publicaciones no constituyen, ni deben considerarse como, asesoramiento o recomendaciones financieras, de inversión, de trading u otro tipo, proporcionadas o respaldadas por TradingView. Obtenga más información en Condiciones de uso.
Exención de responsabilidad
La información y las publicaciones no constituyen, ni deben considerarse como, asesoramiento o recomendaciones financieras, de inversión, de trading u otro tipo, proporcionadas o respaldadas por TradingView. Obtenga más información en Condiciones de uso.