
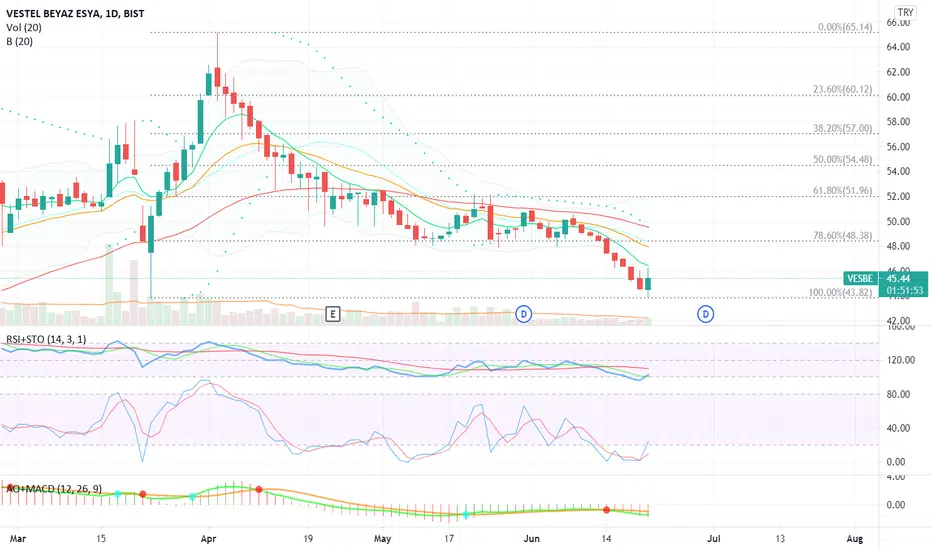
VESBE is technically below (8, 20 and 50 days) moving averages and the recent value is at the bottom of Bollinger Band, but
- RSI cuts up 30
- Stochastic cuts up 20
- Wavetrend is in the oversold area and may need a few more days to cuts up the lower threshold
- Finally, according to its fundamental analysis, VESBE is strong for next 1 year.
I will check VESBE in these days. It touched its 200 days moving average. This point can be a good opportunity to earn up to 10 %. At 48, there is 50 days moving average.
Regards,
Fatih

Exención de responsabilidad
La información y las publicaciones no constituyen, ni deben considerarse como, asesoramiento o recomendaciones financieras, de inversión, de trading u otro tipo, proporcionadas o respaldadas por TradingView. Obtenga más información en Condiciones de uso.
Exención de responsabilidad
La información y las publicaciones no constituyen, ni deben considerarse como, asesoramiento o recomendaciones financieras, de inversión, de trading u otro tipo, proporcionadas o respaldadas por TradingView. Obtenga más información en Condiciones de uso.