
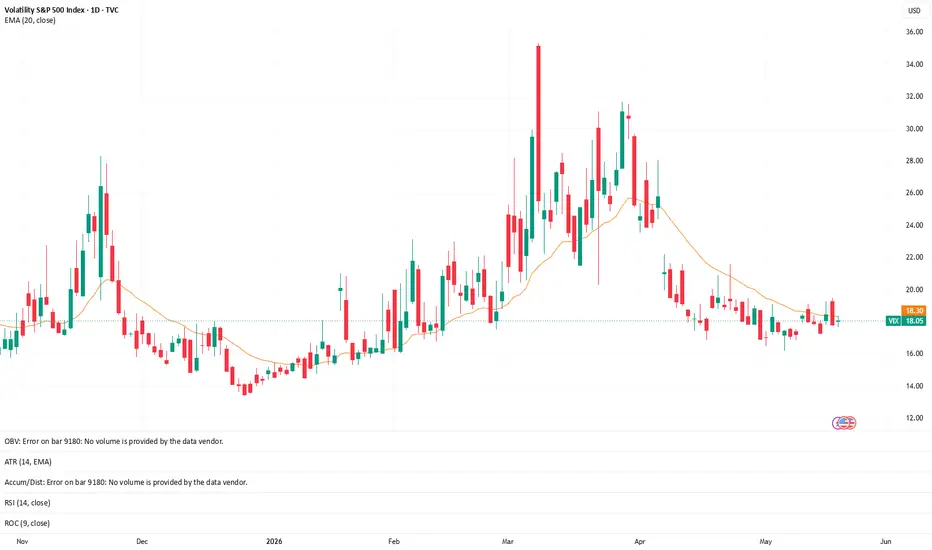
The VIX is often viewed as a fear gauge, but I prefer to approach it through the lens of structure and volatility behavior rather than prediction.
For this framework, I keep the chart intentionally simple:
Price action
20 EMA
Observation of volatility expansion and compression
No indicator overload.
The reason the 20 EMA stands out on the VIX is because volatility tends to move in fast emotional waves. The EMA helps smooth that behavior enough to identify whether volatility pressure is:
expanding
stabilizing
compressing
transitioning
When the VIX begins holding above a rising 20 EMA, it can suggest volatility pressure is becoming more active beneath the surface.
When the VIX remains below a declining 20 EMA, it often reflects a calmer environment where risk appetite and liquidity conditions are stabilizing.
What matters most to me is not the VIX level itself, but the behavior surrounding the trend:
Is the EMA curving higher or flattening out?
Are volatility spikes sustaining or fading quickly?
Is pressure accelerating or cooling?
Does the move align with broader market structure?
This is where context becomes important.
I don’t use the VIX as a standalone directional signal, and I don’t use it to predict tops or bottoms.
Instead, I view it as a confirmation layer alongside:
SPY structure
liquidity behavior
relative strength
broader market participation
The goal is not prediction.
The goal is observing whether volatility conditions are strengthening or weakening as structure evolves across the market.
A clean chart can often reveal more than an overloaded one.
⭐ Final Clarity Note ⭐
The VIX is most useful when viewed as a structural confirmation tool rather than a predictive one. The 20 EMA helps create a cleaner view of whether volatility pressure is expanding or compressing, but context always matters. Observation over prediction. Confirmation over conviction.
For this framework, I keep the chart intentionally simple:
Price action
20 EMA
Observation of volatility expansion and compression
No indicator overload.
The reason the 20 EMA stands out on the VIX is because volatility tends to move in fast emotional waves. The EMA helps smooth that behavior enough to identify whether volatility pressure is:
expanding
stabilizing
compressing
transitioning
When the VIX begins holding above a rising 20 EMA, it can suggest volatility pressure is becoming more active beneath the surface.
When the VIX remains below a declining 20 EMA, it often reflects a calmer environment where risk appetite and liquidity conditions are stabilizing.
What matters most to me is not the VIX level itself, but the behavior surrounding the trend:
Is the EMA curving higher or flattening out?
Are volatility spikes sustaining or fading quickly?
Is pressure accelerating or cooling?
Does the move align with broader market structure?
This is where context becomes important.
I don’t use the VIX as a standalone directional signal, and I don’t use it to predict tops or bottoms.
Instead, I view it as a confirmation layer alongside:
SPY structure
liquidity behavior
relative strength
broader market participation
The goal is not prediction.
The goal is observing whether volatility conditions are strengthening or weakening as structure evolves across the market.
A clean chart can often reveal more than an overloaded one.
⭐ Final Clarity Note ⭐
The VIX is most useful when viewed as a structural confirmation tool rather than a predictive one. The 20 EMA helps create a cleaner view of whether volatility pressure is expanding or compressing, but context always matters. Observation over prediction. Confirmation over conviction.

Exención de responsabilidad
La información y las publicaciones no constituyen, ni deben considerarse como, asesoramiento o recomendaciones financieras, de inversión, de trading u otro tipo, proporcionadas o respaldadas por TradingView. Obtenga más información en Condiciones de uso.
Exención de responsabilidad
La información y las publicaciones no constituyen, ni deben considerarse como, asesoramiento o recomendaciones financieras, de inversión, de trading u otro tipo, proporcionadas o respaldadas por TradingView. Obtenga más información en Condiciones de uso.