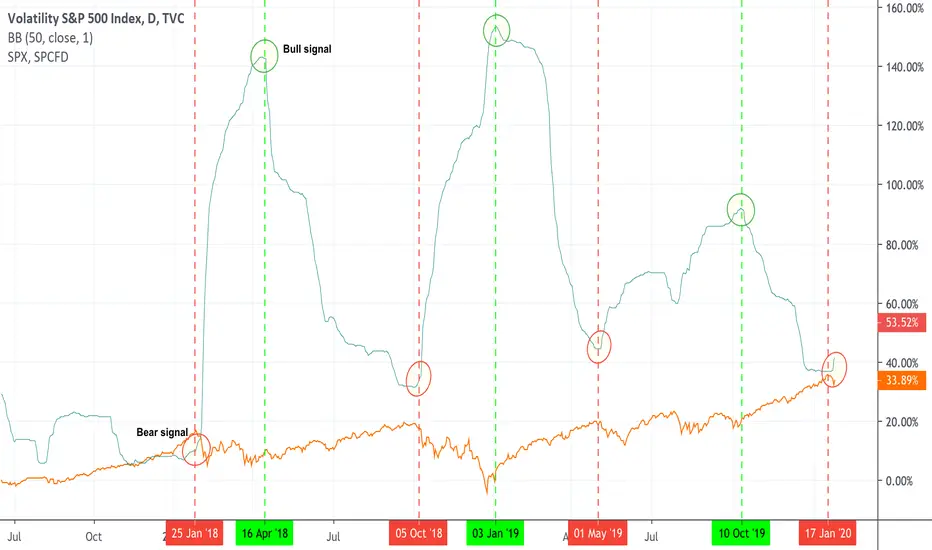
I follow a CFA from Charles Schwab, who uses this signal to establish negative or positive sentiment. To notice how it worked in the past, I have added the S&P500 trend line.
The idea is as follows:
When the upper Bollinger Band (with a 50 period and 1 standard deviation) on the VIX turns higher, that is a bearish sign, and when it turns lower, the SPY tends to rally.
-----------
Also, today January 28th, we had a Hindenburg Omen flash.
The idea is as follows:
When the upper Bollinger Band (with a 50 period and 1 standard deviation) on the
VIX turns higher, that is a bearish sign, and when it turns lower, the SPY tends to rally.-----------
Also, today January 28th, we had a Hindenburg Omen flash.

Exención de responsabilidad
La información y las publicaciones no constituyen, ni deben considerarse como, asesoramiento o recomendaciones financieras, de inversión, de trading u otro tipo, proporcionadas o respaldadas por TradingView. Obtenga más información en Condiciones de uso.
Exención de responsabilidad
La información y las publicaciones no constituyen, ni deben considerarse como, asesoramiento o recomendaciones financieras, de inversión, de trading u otro tipo, proporcionadas o respaldadas por TradingView. Obtenga más información en Condiciones de uso.