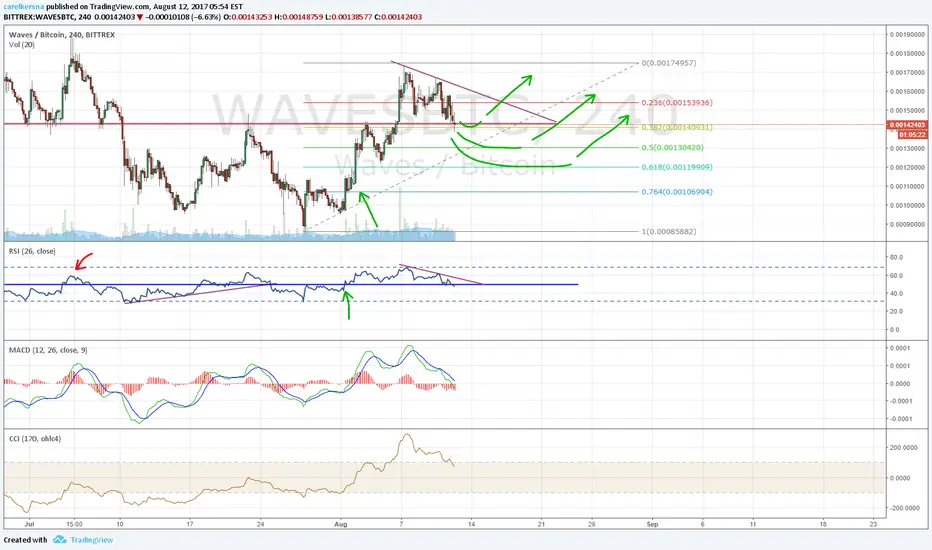
3 levels to watch.
Blue line also represents the 50 line on RSI. Expecting volatility around that level, because every time price makes a great move, RSI breaks below or above 50 level.
So as long as RSI stays above 50, its either movement to the upside or worst case sideways movement.
Blue line also represents the 50 line on RSI. Expecting volatility around that level, because every time price makes a great move, RSI breaks below or above 50 level.
So as long as RSI stays above 50, its either movement to the upside or worst case sideways movement.

Exención de responsabilidad
La información y las publicaciones no constituyen, ni deben considerarse como, asesoramiento o recomendaciones financieras, de inversión, de trading u otro tipo, proporcionadas o respaldadas por TradingView. Obtenga más información en Condiciones de uso.
Exención de responsabilidad
La información y las publicaciones no constituyen, ni deben considerarse como, asesoramiento o recomendaciones financieras, de inversión, de trading u otro tipo, proporcionadas o respaldadas por TradingView. Obtenga más información en Condiciones de uso.