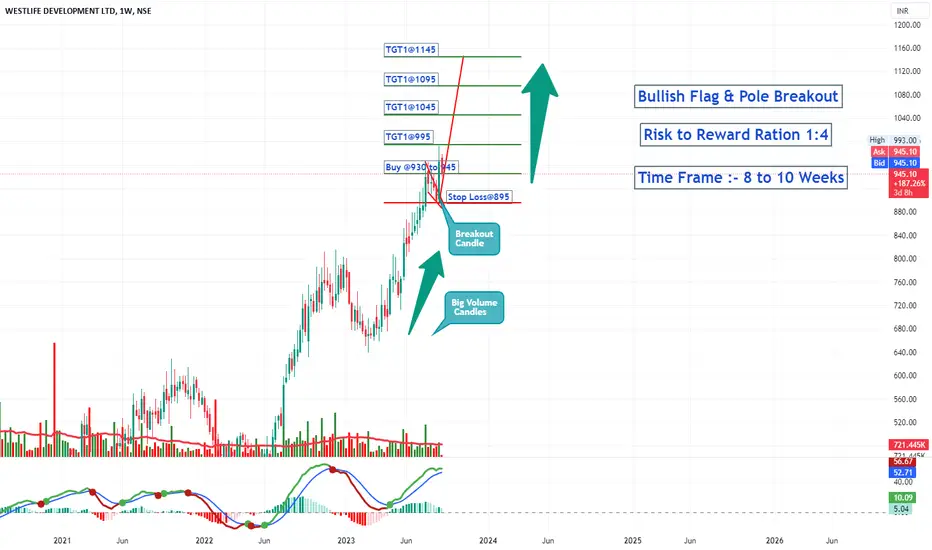
A Bullish Flag and Pole Chart Pattern Breakout happened on the weekly Time frame of  WESTLIFE
Price Action is well supported by the volume.
The stock is currently in uptrend making higher highs and higher lows.
One can add this stock into their stocks to buy list.
Initiate the long trade only according to the levels mentioned.
Stop loss will be on weekly closing basis.
Trend Analysis :- UP Trend
Chart Pattern :- Bullish Flag and Pole
Technical Indicator :- Positive MACD Crossover
WESTLIFE Price Action is well supported by the volume.
The stock is currently in uptrend making higher highs and higher lows.
One can add this stock into their stocks to buy list.
Initiate the long trade only according to the levels mentioned.
Stop loss will be on weekly closing basis.
Trend Analysis :- UP Trend
Chart Pattern :- Bullish Flag and Pole
Technical Indicator :- Positive MACD Crossover
Nota
1st Target Achieved.....Enjoy the Money rain Guyssssssssssssssssss
Publicaciones relacionadas
Exención de responsabilidad
La información y las publicaciones no constituyen, ni deben considerarse como, asesoramiento o recomendaciones financieras, de inversión, de trading u otro tipo, proporcionadas o respaldadas por TradingView. Obtenga más información en Condiciones de uso.