
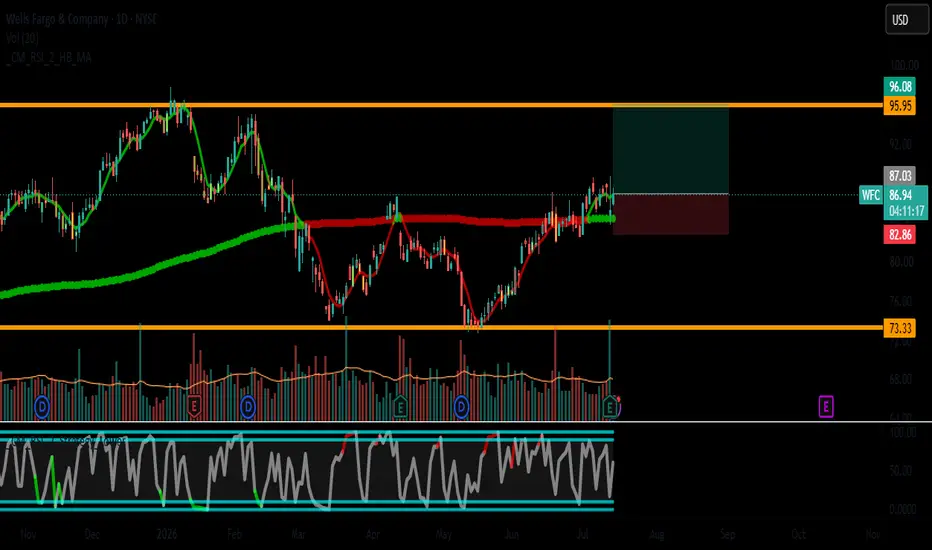
📍 ENTRY: $86.96
🛑 **STOP LOSS:** $82.86 (Risk: $4.10)
🎯 **TAKE PROFIT:** $95.95 (Reward: $8.99)
📊 R:R RATIO: ~1:2.2
🔍 TECHNICAL ANALYSIS (The Signal):
We have a clear Inverse Head and Shoulders (H&S) pattern forming on the daily chart, with the neckline sitting around the $87.50 zone.
Today's candle showed a decisive breakout above the neckline, accompanied by notably higher-than-average volume—confirming the validity of the move.
Price is trading comfortably above the 200 SMA, which is acting as a dynamic support floor and reinforces the long-term bullish trend.
Pattern target: Measuring the depth of the "head" and projecting it upwards gives us a technical target right around the $96 level, which aligns perfectly with my TP.
📊 FUNDAMENTAL ANALYSIS (The Catalyst):
WFC reported Q2 2026 earnings on July 14, and the numbers were rock solid:
✅ EPS of $2.00** crushed consensus estimates of $1.72 (a +$0.28 beat).
✅ **Revenue of $22.62B also topped expectations of $21.87B, marking +9% YoY growth.
✅ ROE of 15% with improving credit quality (net charge-offs declined).
The market punished the stock post-earnings solely because management kept their annual guidance unchanged (NII ~$50B, expenses ~$55.7B). I view this as an overreaction. The guidance was held steady due to prudent macro caution, not operational weakness—in fact, their Markets revenue surged +24% and Investment Banking had a record quarter (+20%).
On top of that, the bank is aggressively returning capital to shareholders: $7B in buybacks + an 11% dividend hike.
🎯 TRADE STRATEGY:
Entry at $86.96: I'm buying the dip into the broken neckline zone (former resistance turning into support) to get a favorable entry with a solid risk/reward profile.
SL at $82.86: Placed just below the right shoulder of the inverse H&S and safely beneath the 200 SMA to avoid getting stopped out by noise or a deep pullback.
TP at $95.95: Positioned at the previous swing highs and the exact projected target of the inverse H&S pattern.
⚠️ RISK MANAGEMENT NOTE:
If price closes decisively below the 200 SMA (approx. $83.50) or breaks below the right shoulder of the pattern, the bullish thesis will be invalidated. That is precisely why my stop is placed where it is.
💬 What are your thoughts? Is anyone else watching this breakout, or do you think the post-earnings correction has further to go?
⚠️ DISCLAIMER:
This is NOT financial or investment advice. This post reflects my personal opinion and analysis based on publicly available information. Trading and investing involve substantial risk, including the potential loss of your entire capital. Past performance does not guarantee future results. Always do your own research (DYOR) and consult with a licensed financial advisor before making any trading decisions. I am not responsible for any losses incurred.
#WFC #Earnings #TradingSetup #TechnicalAnalysis #BankingSector #Stocks #Trading
🛑 **STOP LOSS:** $82.86 (Risk: $4.10)
🎯 **TAKE PROFIT:** $95.95 (Reward: $8.99)
📊 R:R RATIO: ~1:2.2
🔍 TECHNICAL ANALYSIS (The Signal):
We have a clear Inverse Head and Shoulders (H&S) pattern forming on the daily chart, with the neckline sitting around the $87.50 zone.
Today's candle showed a decisive breakout above the neckline, accompanied by notably higher-than-average volume—confirming the validity of the move.
Price is trading comfortably above the 200 SMA, which is acting as a dynamic support floor and reinforces the long-term bullish trend.
Pattern target: Measuring the depth of the "head" and projecting it upwards gives us a technical target right around the $96 level, which aligns perfectly with my TP.
📊 FUNDAMENTAL ANALYSIS (The Catalyst):
WFC reported Q2 2026 earnings on July 14, and the numbers were rock solid:
✅ EPS of $2.00** crushed consensus estimates of $1.72 (a +$0.28 beat).
✅ **Revenue of $22.62B also topped expectations of $21.87B, marking +9% YoY growth.
✅ ROE of 15% with improving credit quality (net charge-offs declined).
The market punished the stock post-earnings solely because management kept their annual guidance unchanged (NII ~$50B, expenses ~$55.7B). I view this as an overreaction. The guidance was held steady due to prudent macro caution, not operational weakness—in fact, their Markets revenue surged +24% and Investment Banking had a record quarter (+20%).
On top of that, the bank is aggressively returning capital to shareholders: $7B in buybacks + an 11% dividend hike.
🎯 TRADE STRATEGY:
Entry at $86.96: I'm buying the dip into the broken neckline zone (former resistance turning into support) to get a favorable entry with a solid risk/reward profile.
SL at $82.86: Placed just below the right shoulder of the inverse H&S and safely beneath the 200 SMA to avoid getting stopped out by noise or a deep pullback.
TP at $95.95: Positioned at the previous swing highs and the exact projected target of the inverse H&S pattern.
⚠️ RISK MANAGEMENT NOTE:
If price closes decisively below the 200 SMA (approx. $83.50) or breaks below the right shoulder of the pattern, the bullish thesis will be invalidated. That is precisely why my stop is placed where it is.
💬 What are your thoughts? Is anyone else watching this breakout, or do you think the post-earnings correction has further to go?
⚠️ DISCLAIMER:
This is NOT financial or investment advice. This post reflects my personal opinion and analysis based on publicly available information. Trading and investing involve substantial risk, including the potential loss of your entire capital. Past performance does not guarantee future results. Always do your own research (DYOR) and consult with a licensed financial advisor before making any trading decisions. I am not responsible for any losses incurred.
#WFC #Earnings #TradingSetup #TechnicalAnalysis #BankingSector #Stocks #Trading

Exención de responsabilidad
La información y las publicaciones no constituyen, ni deben considerarse como, asesoramiento o recomendaciones financieras, de inversión, de trading u otro tipo, proporcionadas o respaldadas por TradingView. Obtenga más información en Condiciones de uso.
Exención de responsabilidad
La información y las publicaciones no constituyen, ni deben considerarse como, asesoramiento o recomendaciones financieras, de inversión, de trading u otro tipo, proporcionadas o respaldadas por TradingView. Obtenga más información en Condiciones de uso.