
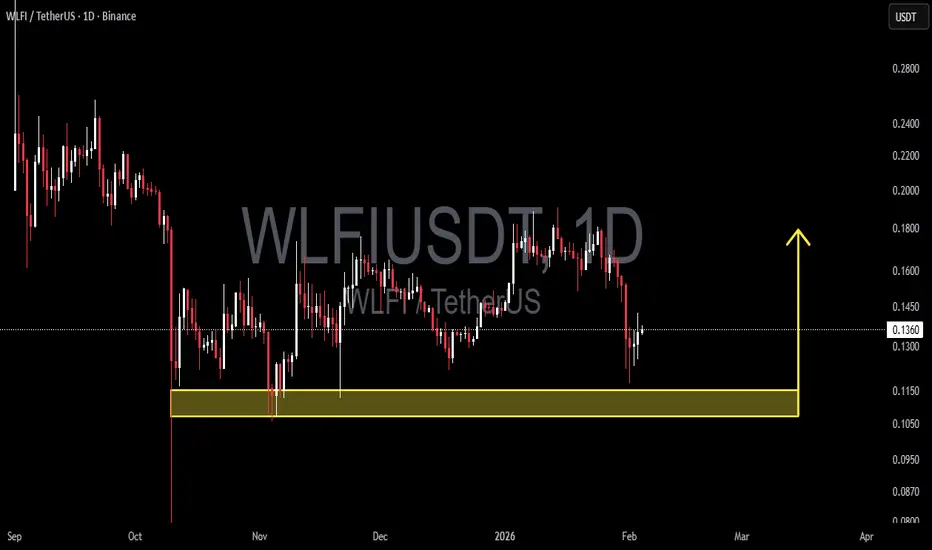
WLFI/USDT on the Daily (1D) timeframe is still moving within a mid-term consolidation phase after experiencing strong selling pressure previously. The current price is trading around the 0.13 – 0.14 area, approaching a major demand zone highlighted by the yellow box at 0.115 – 0.107, which has repeatedly acted as a strong reaction area.
From a structural perspective, the market has not yet formed a valid uptrend and remains range-bound, with increasing volatility as price approaches the demand zone.
---
Pattern & Price Structure
Range / Sideways Market Structure
Price is clearly moving within a range, with mid resistance around 0.17 – 0.18 and strong support at 0.115 – 0.107.
Equal Lows & Liquidity Sweep
Multiple similar lows formed near the demand zone indicate liquidity accumulation, suggesting potential smart money interest.
Rejection Candles from Demand
Previous strong rejections from the yellow zone confirm this area as an institutional accumulation zone, not just a regular support level.
This structure suggests the market is in a waiting phase, with the yellow zone acting as a key decision area.
---
Key Levels
Major Demand / Support: 0.115 – 0.107 (yellow zone)
Minor Support: 0.125 – 0.130
Mid Resistance: 0.150 – 0.155
Major Resistance: 0.170 – 0.180
---
Bullish Scenario
The bullish scenario remains valid if:
1. Price holds above 0.115 – 0.107 without a daily close below it.
2. A higher low forms above the demand zone.
3. A strong break and daily close above 0.150 confirms bullish momentum.
Bullish Targets:
TP1: 0.150
TP2: 0.170
TP3 (extension): 0.185 – 0.200
This scenario indicates that the yellow zone serves as a strong accumulation base, allowing price to perform a mean reversion toward the upper range.
---
Bearish Scenario
The bearish scenario is triggered if:
1. Price makes a valid daily close below 0.107.
2. The demand zone fails to hold selling pressure.
3. Breakdown is accompanied by strong momentum or impulsive candles.
Bearish Targets:
TP1: 0.100
TP2: 0.092
TP3 (extension): 0.085
A breakdown below the yellow zone would shift the structure into a bearish continuation, opening room for further downside.
---
Conclusion
The yellow zone at 0.115 – 0.107 is a critical decision area. As long as price holds above this zone, the potential for a mid-term rebound and reversal remains valid. However, a daily close below this zone would be a strong signal that sellers are back in control.
The market is currently at a decision point, making proper risk management and price action confirmation essential.
#WLFIUSDT #CryptoAnalysis #Altcoin #DailyChart #DemandZone #SupportResistance #BullishScenario #BearishScenario #PriceAction #MarketStructure
From a structural perspective, the market has not yet formed a valid uptrend and remains range-bound, with increasing volatility as price approaches the demand zone.
---
Pattern & Price Structure
Range / Sideways Market Structure
Price is clearly moving within a range, with mid resistance around 0.17 – 0.18 and strong support at 0.115 – 0.107.
Equal Lows & Liquidity Sweep
Multiple similar lows formed near the demand zone indicate liquidity accumulation, suggesting potential smart money interest.
Rejection Candles from Demand
Previous strong rejections from the yellow zone confirm this area as an institutional accumulation zone, not just a regular support level.
This structure suggests the market is in a waiting phase, with the yellow zone acting as a key decision area.
---
Key Levels
Major Demand / Support: 0.115 – 0.107 (yellow zone)
Minor Support: 0.125 – 0.130
Mid Resistance: 0.150 – 0.155
Major Resistance: 0.170 – 0.180
---
Bullish Scenario
The bullish scenario remains valid if:
1. Price holds above 0.115 – 0.107 without a daily close below it.
2. A higher low forms above the demand zone.
3. A strong break and daily close above 0.150 confirms bullish momentum.
Bullish Targets:
TP1: 0.150
TP2: 0.170
TP3 (extension): 0.185 – 0.200
This scenario indicates that the yellow zone serves as a strong accumulation base, allowing price to perform a mean reversion toward the upper range.
---
Bearish Scenario
The bearish scenario is triggered if:
1. Price makes a valid daily close below 0.107.
2. The demand zone fails to hold selling pressure.
3. Breakdown is accompanied by strong momentum or impulsive candles.
Bearish Targets:
TP1: 0.100
TP2: 0.092
TP3 (extension): 0.085
A breakdown below the yellow zone would shift the structure into a bearish continuation, opening room for further downside.
---
Conclusion
The yellow zone at 0.115 – 0.107 is a critical decision area. As long as price holds above this zone, the potential for a mid-term rebound and reversal remains valid. However, a daily close below this zone would be a strong signal that sellers are back in control.
The market is currently at a decision point, making proper risk management and price action confirmation essential.
#WLFIUSDT #CryptoAnalysis #Altcoin #DailyChart #DemandZone #SupportResistance #BullishScenario #BearishScenario #PriceAction #MarketStructure

✅ Get Free Signals! Join Our Telegram Channel Here: t.me/TheCryptoNuclear
✅ Twitter: twitter.com/crypto_nuclear
✅ Join Bybit : partner.bybit.com/b/nuclearvip
✅ Benefits : Lifetime Trading Fee Discount -50%
✅ Twitter: twitter.com/crypto_nuclear
✅ Join Bybit : partner.bybit.com/b/nuclearvip
✅ Benefits : Lifetime Trading Fee Discount -50%
Exención de responsabilidad
La información y las publicaciones no constituyen, ni deben considerarse como, asesoramiento o recomendaciones financieras, de inversión, de trading u otro tipo, proporcionadas o respaldadas por TradingView. Obtenga más información en Condiciones de uso.
✅ Get Free Signals! Join Our Telegram Channel Here: t.me/TheCryptoNuclear
✅ Twitter: twitter.com/crypto_nuclear
✅ Join Bybit : partner.bybit.com/b/nuclearvip
✅ Benefits : Lifetime Trading Fee Discount -50%
✅ Twitter: twitter.com/crypto_nuclear
✅ Join Bybit : partner.bybit.com/b/nuclearvip
✅ Benefits : Lifetime Trading Fee Discount -50%
Exención de responsabilidad
La información y las publicaciones no constituyen, ni deben considerarse como, asesoramiento o recomendaciones financieras, de inversión, de trading u otro tipo, proporcionadas o respaldadas por TradingView. Obtenga más información en Condiciones de uso.