
31/03/2026
Forex & Asset Bias Map: Relative Strength Hierarchy in a War-Driven Market
🌏The market remains dominated by the war premium in the Middle East. Even with reports of possible de-escalation, the partial closure of Hormuz and the risk to global energy flows are still keeping oil at elevated levels. That continues to support the dollar as the main safe haven, pressure currencies from energy-importing economies, and limit the recovery of risk assets. Europe and Japan remain among the most vulnerable regions in this environment, while equities and crypto are only reacting partially to relief headlines.
⚠️This map is not an automatic entry signal. Its purpose is to show where relative strength and weakness are clearest, so the chart can then be used to look for confirmation through structure, liquidity, price action, and volume.
📌Direct category summary
🟢Strong bullish
USDJPY
CADJPY
GBPJPY
EURJPY
AUDJPY
🟢Moderate bullish
USDCHF
GBPCHF
GBPAUD
GBPNZD
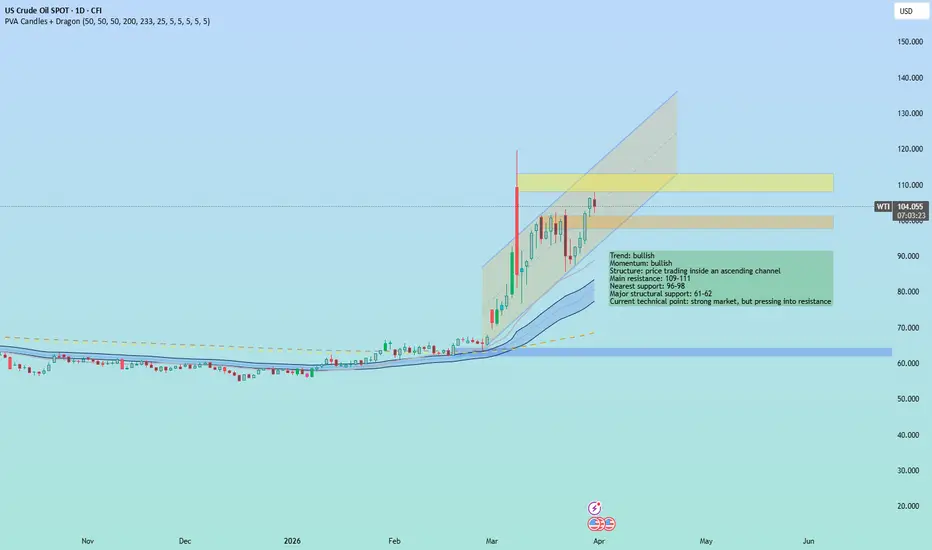
XTIUSD / Oil
🔵 Neutral
USDCAD
EURAUD
AUDNZD
BTCUSD / Bitcoin
XAUUSD / Gold
XAGUSD / Silver
🟠 Moderate bearish
EURUSD
GBPUSD
AUDUSD
EURNZD
EURGBP
SPX500
🔴 Strong bearish
NZDUSD
NZDJPY
📚Key readings
🟢USDJPY
The bias remains strongly bullish because the yen continues to be one of the weakest currencies in the current macro environment. Instead of acting as a classic safe haven, JPY has been penalized by high oil prices, imported inflation, and stress on Japanese assets. Japanese officials have already described the recent weakness in the currency as speculative, which shows official concern, but that alone does not change the structural direction. In practice, the pair remains supported as long as the market continues to price expensive energy and broad dollar strength. The main risk to longs is direct or verbal currency intervention, which could trigger sharp countertrend corrections.
🟢CADJPY
This is one of the crosses most aligned with the dominant macro theme right now. The Canadian dollar tends to receive support from oil, while the yen is hurt by the exact same energy shock. That creates a very clear asymmetry: a currency linked to an energy exporter against the currency of a major energy importer. As long as crude keeps carrying a war premium, CAD tends to maintain its relative advantage. The main risk here would be a sudden drop in oil if a more concrete geopolitical de-escalation emerges.
🟢GBPJPY
Sterling is not in a perfect environment in absolute terms, but against the yen the contrast still favors upside. The market has been pricing a relatively firmer monetary stance in the United Kingdom because of energy-driven inflation, while Japan remains more vulnerable to the oil shock. That does not mean the pound is fundamentally strong in a healthy way; it simply means that the short leg of the pair remains structurally weaker. This is a classic case where relative strength matters more than absolute strength. If the yen continues to stay under pressure, GBPJPY can remain among the better-supported crosses.
🟢EURJPY
The euro is not comfortable either, since the euro area is once again facing inflation above target driven by energy, while growth continues to soften. Even so, the yen remains more vulnerable than the euro in the current setup. That is why the pair still holds a strong bullish bias, although it is not as clean as USDJPY or CADJPY. The logic here is not “strong euro,” but “weaker yen.” That distinction matters because it changes how pullbacks and extensions should be interpreted on the chart.
🟢AUDJPY
This is a more tactical case, but still with a strong bullish bias. The Australian dollar usually suffers when markets move into a risk-off mode, yet the yen has been suffering even more. That preserves AUD’s relative advantage in the cross, even though AUD itself is not especially strong in isolation. This pair is more vulnerable to shifts in global sentiment than CADJPY because AUD depends more heavily on the broader growth outlook. Even so, for now, yen weakness remains the dominant factor.
🟢USDCHF
The dollar has been capturing defensive demand better than the franc during this phase of the crisis. That is somewhat different from the more classic pattern, but the market has been favoring cash in USD, both because of its safe-haven role and because the United States is an energy exporter. Even so, I would not classify it as strongly bullish because CHF remains a defensive currency and could quickly regain prominence if risk aversion intensifies further or if the dollar loses traction. So the bullish bias is real, but the conviction is lower than in the JPY pairs.
🟢GBPCHF
Sterling gained relative support because of the strong shift in rate expectations in the UK, while CHF did not dominate defensive flows as clearly as in other crises. That creates room for a moderately bullish bias in the pair. The main caveat is that UK growth remains fragile and the energy shock also weighs on the British economy, so this is not a clean bullish case based on healthy fundamentals. The bias exists more because of relative differentiation than because of broad macro strength in sterling.
🟢GBPAUD
Here, sterling has a relative advantage because the market has priced a firmer UK rate path, while AUD continues to suffer from global slowdown risk, expensive energy, and risk-off conditions. That tends to keep pressure on pro-growth currencies. The reason this is classified as moderately bullish rather than strongly bullish is that the UK is also negatively affected by high energy costs, and AUD can react well if any geopolitical relief window opens. Even so, at this stage, the asymmetry still favors sterling.
🟢GBPNZD
The logic is similar to GBPAUD, but with an even weaker short leg. The kiwi usually responds worse than AUD in risk-off conditions, during periods of dollar strength, and when the market fears global slowdown. That means sterling does not need to be especially strong for the pair to rise; NZD simply needs to remain under pressure. For that reason, GBPNZD remains among the crosses with relatively favorable asymmetry in the current environment. It is more a reflection of kiwi weakness than pure pound strength.
🟢XTIUSD / Oil
Oil continues to hold a moderately bullish bias because it still carries a strong geopolitical premium. Disruptions in energy routes, supply fears, and the situation around Hormuz keep the market highly sensitive to any headline related to the conflict. At the same time, the asset has already shown that reports about a possible end to the military campaign can trigger sharp corrections. So the structure remains bullish, but extremely headline-dependent. In short, the trend still points upward, but with high volatility and frequent intraday reversals.
🔵USDCAD
This is the most balanced major on the map. On one side, the US dollar remains very strong, supported by defensive flows and by the energy profile of the US economy. On the other side, CAD receives important support from higher oil prices. Those two forces largely offset each other, which makes the pair more neutral than directional. The tiebreaker is likely to come from oil itself: if crude extends higher, CAD gains support; if crude drops sharply, USD is likely to dominate more clearly.
🔵EURAUD
The euro is under pressure from energy inflation and weaker euro area growth, but AUD is also suffering from global risk and dollar strength. That makes the cross less directional than it may appear at first glance. In a pure energy panic scenario, the euro could suffer more; in a broader improvement in global sentiment, AUD would likely react better. That is why the bias stays neutral. This is a pair that depends heavily on the next macro leg before it can leave this gray zone.
🔵AUDNZD
Both sides tend to suffer when markets enter a stronger risk-off phase, and the difference between them is often more about intensity than structural direction. NZD tends to be somewhat weaker, which could suggest a bullish bias in the cross, but right now I do not see enough asymmetry to treat it as one of the cleaner readings on the map. It is a cross that is more sensitive to local data nuances and to regional growth perception. For that reason, the neutral classification remains the most balanced one.
🔵BTCUSD / Bitcoin
Bitcoin remains stuck between being an alternative asset and being a risk asset, but in this phase it is still behaving more like a risk asset than a true hedge. It can rise during geopolitical relief windows, especially if Nasdaq and broader sentiment improve, but it remains vulnerable to a stronger dollar, tighter financial conditions, and macro instability. In addition, technically, BTC appears trapped inside a typical bearish continuation structure, which keeps the market compressed. In this kind of setup, an external trigger — whether geopolitical deterioration, additional dollar strength, or another drop in risk appetite — could activate the breakdown of the pattern and release a stronger bearish move. The positive side is that it does not appear to be collapsing indiscriminately; the negative side is that it still has not demonstrated enough independence to justify a consistent bullish bias. For now, neutral remains the most appropriate classification.
🔵XAUUSD / Gold
Gold is in an unusual situation. Despite the war backdrop, it is still under pressure because dollar strength and the delay in US rate-cut expectations are weighing more heavily than the metal’s classic safe-haven appeal. There have been tactical rebounds and dip buying on days of greater stress, but the metal has not behaved like a clean hedge. That leaves gold caught in a kind of internal conflict between its traditional role and the reality of the current global flow structure. That is why the bias remains neutral, although unstable.
🔵XAGUSD / Silver
Silver shares part of gold’s behavior, but it also has a more significant industrial component, which makes it even more sensitive to concerns about global growth. That increases its vulnerability when the market fears slowdown, while still allowing for strong rebounds when risk sentiment improves. At the moment, the setup does not provide clear directional conviction in either direction. That is why neutral remains the most appropriate reading. It is an asset that can swing sharply without that necessarily meaning an immediate structural shift in bias.
🟠EURUSD
The euro remains pressured by the energy shock. Inflation above target is not a sign of healthy strength; it is bad inflation, driven by energy, alongside weaker growth. On the other side of the pair, the dollar remains the main global safe haven. That keeps the pair under bearish pressure. The reason I do not classify it as strongly bearish is that part of this damage has already been priced, and any more concrete headline around de-escalation could help the euro breathe. Even so, for now, the balance still leans to the downside.
🟠GBPUSD
Sterling is more resilient than the euro because the market has priced a firmer rate path in the UK. Even so, it still loses in comparison to the dollar, which dominates defensive flows. In addition, the UK is also dealing with expensive energy and weaker growth prospects. For that reason, the bias remains moderately bearish. It is less weak than EURUSD in relative terms, but still unfavorable for longs as long as the dollar remains in control.
🟠AUDUSD
AUD suffers when the market fears global slowdown, tighter financial conditions, and weakening growth. The problem is that this is exactly the environment it is facing right now, with a strong dollar on the other side. There is some support from the broader commodity universe, but not enough to reverse the picture. So the bias remains moderately bearish. It is still a structurally sellable pair from a macro perspective, although prone to sharp rebounds if risk appetite improves.
🟠EURNZD
This cross tends to favor the euro over the kiwi during risk-off periods, but the euro is also weakened by the energy shock. Since both sides have relevant problems, EUR has an advantage, but not with maximum conviction. This is a moderate bias supported more by the relative weakness of NZD than by real strength in EUR. That means the pair requires more careful technical context selection and less aggression based on macro logic alone.
🟠EURGBP
The market has been favoring sterling over the euro because of the divergence in rate expectations. The ECB is trapped between bad inflation and weak growth, while the BoE, at least for now, appears relatively more inclined to stay firm in response to the energy shock. That tends to keep the euro under pressure against sterling. I do not classify it as strongly bearish because the UK also has important fragilities. Still, at this stage, the relative hierarchy favors the British currency.
🟠SPX500
The US equity index can still produce rebounds whenever de-escalation headlines appear, but the broader backdrop remains difficult. Expensive oil worsens inflation, complicates the Fed, pressures corporate margins, and weighs especially on technology and other long-duration assets. The market already showed that in the previous session, with significant pressure on Nasdaq and broader weakness during the month. For that reason, the bias remains moderately bearish: highly headline-sensitive, but still structurally pressured.
🔴NZDUSD
Among the classic risk-linked majors, the kiwi remains one of the most vulnerable currencies. It suffers from dollar strength, risk aversion, fears of global slowdown, and the lack of defensive characteristics. In an international stress environment with expensive energy, it is difficult to build a consistent bullish case for NZD against USD. That is why it remains one of the clearest macro sell candidates on the map. As long as the dollar remains dominant, kiwi is likely to stay among the weakest ends of the hierarchy.
🔴NZDJPY
This cross carries structural downside pressure because NZD is highly sensitive to growth and risk, and the current environment remains hostile to that profile. The complication is that JPY is also very weak, which makes the pair’s behavior less linear than it might otherwise be. Even so, during sharper deterioration in global sentiment, kiwi tends to suffer significantly, and that keeps the overall bias weak. It is a more dangerous and less clean pair than USDJPY, but still vulnerable in the current framework.
💡Final reading
The map remains clearly pro-dollar, pro-oil, and against currencies that are more sensitive to global growth, with the yen occupying an unusually weak position for a crisis environment. What could reverse this picture is not simply one positive headline, but a more concrete perception that the war is genuinely losing intensity and that the energy premium is being removed from the system. Until that happens in a convincing way, the structure still favors a strong dollar, supported oil, and pressure on cyclical currencies and part of the risk-asset complex.
As with any bias map, this reading is dynamic and should be combined with multi-timeframe technical analysis, structure, liquidity, and confirmation through price action and volume before any operational decision. That is the step that separates context from execution.
⚠️This content is for educational and informational purposes only. It is not financial advice. Always manage risk with discipline.
If this analysis added value:
👍like the post
💬comment your bias
⭐and follow the profile for more studies on liquidity, structure, and price action.
FX Liquidity Lab
Understand liquidity. Anticipate the move.
Forex & Asset Bias Map: Relative Strength Hierarchy in a War-Driven Market
🌏The market remains dominated by the war premium in the Middle East. Even with reports of possible de-escalation, the partial closure of Hormuz and the risk to global energy flows are still keeping oil at elevated levels. That continues to support the dollar as the main safe haven, pressure currencies from energy-importing economies, and limit the recovery of risk assets. Europe and Japan remain among the most vulnerable regions in this environment, while equities and crypto are only reacting partially to relief headlines.
⚠️This map is not an automatic entry signal. Its purpose is to show where relative strength and weakness are clearest, so the chart can then be used to look for confirmation through structure, liquidity, price action, and volume.
📌Direct category summary
🟢Strong bullish
USDJPY
CADJPY
GBPJPY
EURJPY
AUDJPY
🟢Moderate bullish
USDCHF
GBPCHF
GBPAUD
GBPNZD
XTIUSD / Oil
🔵 Neutral
USDCAD
EURAUD
AUDNZD
BTCUSD / Bitcoin
XAUUSD / Gold
XAGUSD / Silver
🟠 Moderate bearish
EURUSD
GBPUSD
AUDUSD
EURNZD
EURGBP
SPX500
🔴 Strong bearish
NZDUSD
NZDJPY
📚Key readings
🟢USDJPY
The bias remains strongly bullish because the yen continues to be one of the weakest currencies in the current macro environment. Instead of acting as a classic safe haven, JPY has been penalized by high oil prices, imported inflation, and stress on Japanese assets. Japanese officials have already described the recent weakness in the currency as speculative, which shows official concern, but that alone does not change the structural direction. In practice, the pair remains supported as long as the market continues to price expensive energy and broad dollar strength. The main risk to longs is direct or verbal currency intervention, which could trigger sharp countertrend corrections.
🟢CADJPY
This is one of the crosses most aligned with the dominant macro theme right now. The Canadian dollar tends to receive support from oil, while the yen is hurt by the exact same energy shock. That creates a very clear asymmetry: a currency linked to an energy exporter against the currency of a major energy importer. As long as crude keeps carrying a war premium, CAD tends to maintain its relative advantage. The main risk here would be a sudden drop in oil if a more concrete geopolitical de-escalation emerges.
🟢GBPJPY
Sterling is not in a perfect environment in absolute terms, but against the yen the contrast still favors upside. The market has been pricing a relatively firmer monetary stance in the United Kingdom because of energy-driven inflation, while Japan remains more vulnerable to the oil shock. That does not mean the pound is fundamentally strong in a healthy way; it simply means that the short leg of the pair remains structurally weaker. This is a classic case where relative strength matters more than absolute strength. If the yen continues to stay under pressure, GBPJPY can remain among the better-supported crosses.
🟢EURJPY
The euro is not comfortable either, since the euro area is once again facing inflation above target driven by energy, while growth continues to soften. Even so, the yen remains more vulnerable than the euro in the current setup. That is why the pair still holds a strong bullish bias, although it is not as clean as USDJPY or CADJPY. The logic here is not “strong euro,” but “weaker yen.” That distinction matters because it changes how pullbacks and extensions should be interpreted on the chart.
🟢AUDJPY
This is a more tactical case, but still with a strong bullish bias. The Australian dollar usually suffers when markets move into a risk-off mode, yet the yen has been suffering even more. That preserves AUD’s relative advantage in the cross, even though AUD itself is not especially strong in isolation. This pair is more vulnerable to shifts in global sentiment than CADJPY because AUD depends more heavily on the broader growth outlook. Even so, for now, yen weakness remains the dominant factor.
🟢USDCHF
The dollar has been capturing defensive demand better than the franc during this phase of the crisis. That is somewhat different from the more classic pattern, but the market has been favoring cash in USD, both because of its safe-haven role and because the United States is an energy exporter. Even so, I would not classify it as strongly bullish because CHF remains a defensive currency and could quickly regain prominence if risk aversion intensifies further or if the dollar loses traction. So the bullish bias is real, but the conviction is lower than in the JPY pairs.
🟢GBPCHF
Sterling gained relative support because of the strong shift in rate expectations in the UK, while CHF did not dominate defensive flows as clearly as in other crises. That creates room for a moderately bullish bias in the pair. The main caveat is that UK growth remains fragile and the energy shock also weighs on the British economy, so this is not a clean bullish case based on healthy fundamentals. The bias exists more because of relative differentiation than because of broad macro strength in sterling.
🟢GBPAUD
Here, sterling has a relative advantage because the market has priced a firmer UK rate path, while AUD continues to suffer from global slowdown risk, expensive energy, and risk-off conditions. That tends to keep pressure on pro-growth currencies. The reason this is classified as moderately bullish rather than strongly bullish is that the UK is also negatively affected by high energy costs, and AUD can react well if any geopolitical relief window opens. Even so, at this stage, the asymmetry still favors sterling.
🟢GBPNZD
The logic is similar to GBPAUD, but with an even weaker short leg. The kiwi usually responds worse than AUD in risk-off conditions, during periods of dollar strength, and when the market fears global slowdown. That means sterling does not need to be especially strong for the pair to rise; NZD simply needs to remain under pressure. For that reason, GBPNZD remains among the crosses with relatively favorable asymmetry in the current environment. It is more a reflection of kiwi weakness than pure pound strength.
🟢XTIUSD / Oil
Oil continues to hold a moderately bullish bias because it still carries a strong geopolitical premium. Disruptions in energy routes, supply fears, and the situation around Hormuz keep the market highly sensitive to any headline related to the conflict. At the same time, the asset has already shown that reports about a possible end to the military campaign can trigger sharp corrections. So the structure remains bullish, but extremely headline-dependent. In short, the trend still points upward, but with high volatility and frequent intraday reversals.
🔵USDCAD
This is the most balanced major on the map. On one side, the US dollar remains very strong, supported by defensive flows and by the energy profile of the US economy. On the other side, CAD receives important support from higher oil prices. Those two forces largely offset each other, which makes the pair more neutral than directional. The tiebreaker is likely to come from oil itself: if crude extends higher, CAD gains support; if crude drops sharply, USD is likely to dominate more clearly.
🔵EURAUD
The euro is under pressure from energy inflation and weaker euro area growth, but AUD is also suffering from global risk and dollar strength. That makes the cross less directional than it may appear at first glance. In a pure energy panic scenario, the euro could suffer more; in a broader improvement in global sentiment, AUD would likely react better. That is why the bias stays neutral. This is a pair that depends heavily on the next macro leg before it can leave this gray zone.
🔵AUDNZD
Both sides tend to suffer when markets enter a stronger risk-off phase, and the difference between them is often more about intensity than structural direction. NZD tends to be somewhat weaker, which could suggest a bullish bias in the cross, but right now I do not see enough asymmetry to treat it as one of the cleaner readings on the map. It is a cross that is more sensitive to local data nuances and to regional growth perception. For that reason, the neutral classification remains the most balanced one.
🔵BTCUSD / Bitcoin
Bitcoin remains stuck between being an alternative asset and being a risk asset, but in this phase it is still behaving more like a risk asset than a true hedge. It can rise during geopolitical relief windows, especially if Nasdaq and broader sentiment improve, but it remains vulnerable to a stronger dollar, tighter financial conditions, and macro instability. In addition, technically, BTC appears trapped inside a typical bearish continuation structure, which keeps the market compressed. In this kind of setup, an external trigger — whether geopolitical deterioration, additional dollar strength, or another drop in risk appetite — could activate the breakdown of the pattern and release a stronger bearish move. The positive side is that it does not appear to be collapsing indiscriminately; the negative side is that it still has not demonstrated enough independence to justify a consistent bullish bias. For now, neutral remains the most appropriate classification.
🔵XAUUSD / Gold
Gold is in an unusual situation. Despite the war backdrop, it is still under pressure because dollar strength and the delay in US rate-cut expectations are weighing more heavily than the metal’s classic safe-haven appeal. There have been tactical rebounds and dip buying on days of greater stress, but the metal has not behaved like a clean hedge. That leaves gold caught in a kind of internal conflict between its traditional role and the reality of the current global flow structure. That is why the bias remains neutral, although unstable.
🔵XAGUSD / Silver
Silver shares part of gold’s behavior, but it also has a more significant industrial component, which makes it even more sensitive to concerns about global growth. That increases its vulnerability when the market fears slowdown, while still allowing for strong rebounds when risk sentiment improves. At the moment, the setup does not provide clear directional conviction in either direction. That is why neutral remains the most appropriate reading. It is an asset that can swing sharply without that necessarily meaning an immediate structural shift in bias.
🟠EURUSD
The euro remains pressured by the energy shock. Inflation above target is not a sign of healthy strength; it is bad inflation, driven by energy, alongside weaker growth. On the other side of the pair, the dollar remains the main global safe haven. That keeps the pair under bearish pressure. The reason I do not classify it as strongly bearish is that part of this damage has already been priced, and any more concrete headline around de-escalation could help the euro breathe. Even so, for now, the balance still leans to the downside.
🟠GBPUSD
Sterling is more resilient than the euro because the market has priced a firmer rate path in the UK. Even so, it still loses in comparison to the dollar, which dominates defensive flows. In addition, the UK is also dealing with expensive energy and weaker growth prospects. For that reason, the bias remains moderately bearish. It is less weak than EURUSD in relative terms, but still unfavorable for longs as long as the dollar remains in control.
🟠AUDUSD
AUD suffers when the market fears global slowdown, tighter financial conditions, and weakening growth. The problem is that this is exactly the environment it is facing right now, with a strong dollar on the other side. There is some support from the broader commodity universe, but not enough to reverse the picture. So the bias remains moderately bearish. It is still a structurally sellable pair from a macro perspective, although prone to sharp rebounds if risk appetite improves.
🟠EURNZD
This cross tends to favor the euro over the kiwi during risk-off periods, but the euro is also weakened by the energy shock. Since both sides have relevant problems, EUR has an advantage, but not with maximum conviction. This is a moderate bias supported more by the relative weakness of NZD than by real strength in EUR. That means the pair requires more careful technical context selection and less aggression based on macro logic alone.
🟠EURGBP
The market has been favoring sterling over the euro because of the divergence in rate expectations. The ECB is trapped between bad inflation and weak growth, while the BoE, at least for now, appears relatively more inclined to stay firm in response to the energy shock. That tends to keep the euro under pressure against sterling. I do not classify it as strongly bearish because the UK also has important fragilities. Still, at this stage, the relative hierarchy favors the British currency.
🟠SPX500
The US equity index can still produce rebounds whenever de-escalation headlines appear, but the broader backdrop remains difficult. Expensive oil worsens inflation, complicates the Fed, pressures corporate margins, and weighs especially on technology and other long-duration assets. The market already showed that in the previous session, with significant pressure on Nasdaq and broader weakness during the month. For that reason, the bias remains moderately bearish: highly headline-sensitive, but still structurally pressured.
🔴NZDUSD
Among the classic risk-linked majors, the kiwi remains one of the most vulnerable currencies. It suffers from dollar strength, risk aversion, fears of global slowdown, and the lack of defensive characteristics. In an international stress environment with expensive energy, it is difficult to build a consistent bullish case for NZD against USD. That is why it remains one of the clearest macro sell candidates on the map. As long as the dollar remains dominant, kiwi is likely to stay among the weakest ends of the hierarchy.
🔴NZDJPY
This cross carries structural downside pressure because NZD is highly sensitive to growth and risk, and the current environment remains hostile to that profile. The complication is that JPY is also very weak, which makes the pair’s behavior less linear than it might otherwise be. Even so, during sharper deterioration in global sentiment, kiwi tends to suffer significantly, and that keeps the overall bias weak. It is a more dangerous and less clean pair than USDJPY, but still vulnerable in the current framework.
💡Final reading
The map remains clearly pro-dollar, pro-oil, and against currencies that are more sensitive to global growth, with the yen occupying an unusually weak position for a crisis environment. What could reverse this picture is not simply one positive headline, but a more concrete perception that the war is genuinely losing intensity and that the energy premium is being removed from the system. Until that happens in a convincing way, the structure still favors a strong dollar, supported oil, and pressure on cyclical currencies and part of the risk-asset complex.
As with any bias map, this reading is dynamic and should be combined with multi-timeframe technical analysis, structure, liquidity, and confirmation through price action and volume before any operational decision. That is the step that separates context from execution.
⚠️This content is for educational and informational purposes only. It is not financial advice. Always manage risk with discipline.
If this analysis added value:
👍like the post
💬comment your bias
⭐and follow the profile for more studies on liquidity, structure, and price action.
FX Liquidity Lab
Understand liquidity. Anticipate the move.

Exención de responsabilidad
La información y las publicaciones no constituyen, ni deben considerarse como, asesoramiento o recomendaciones financieras, de inversión, de trading u otro tipo, proporcionadas o respaldadas por TradingView. Obtenga más información en Condiciones de uso.
Exención de responsabilidad
La información y las publicaciones no constituyen, ni deben considerarse como, asesoramiento o recomendaciones financieras, de inversión, de trading u otro tipo, proporcionadas o respaldadas por TradingView. Obtenga más información en Condiciones de uso.