
════════════════════════════════════════════════════════════════
XAUUSD (Gold / US Dollar) — 4H CHART ANALYSIS
Trade Idea | Phoenix Algo TMA | Date: 21 June 2026
════════════════════════════════════════════════════════════════
CURRENT PRICE: $4,155.41
TIMEFRAME: 4-Hour
INDICATOR: TMA – Phoenix Algo (The Phoenix v1)
BIAS: BEARISH (macro trend) / CAUTIOUS on counter-trend long
────────────────────────────────────────────────────────────────
OVERVIEW
────────────────────────────────────────────────────────────────
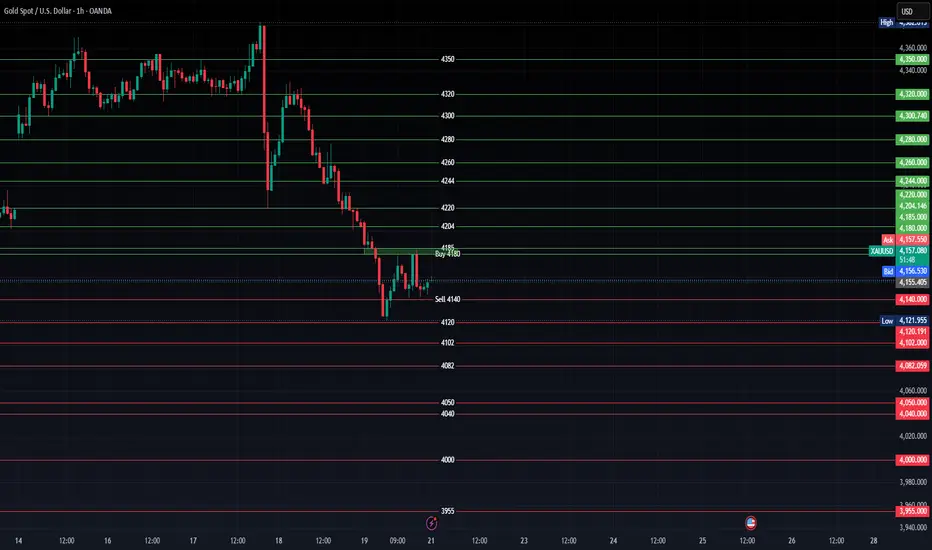
Gold has been in a sustained downtrend over the last 100 bars
(~16 days) on the 4H chart, declining -6.78% from a high of
$4,595.33 down to a current low of $4,023.87. Price is now in a
key decision zone, trading between a marked BUY level at 4,180
and a SELL trigger at 4,140 — a no-man's land of only ~40 pts.
The current 4H candle OPENED at 4,179 (right at the Buy zone),
rejected, and has since fallen to 4,155 — a significant bearish
signal that the buy zone is struggling to hold as support.
────────────────────────────────────────────────────────────────
YOUR MARKED LEVELS — FULL MAP
────────────────────────────────────────────────────────────────
[ BUY SIDE — Green Lines ]
▲ 4,350 — Extended bull target / strong resistance
▲ 4,320 — Resistance cluster
▲ 4,300 — Psychological round number resistance
▲ 4,280 — Prior structure resistance
▲ 4,260 — Resistance level
▲ 4,244 — Resistance level
▲ 4,220 — Resistance level
▲ 4,204 — First overhead resistance
┌─────────────────────────────┐
│ BUY ZONE: 4,180 – 4,185 │ ← Green rectangle / entry box
└─────────────────────────────┘
◉ CURRENT PRICE: $4,155.41 ← Between the two setups
┌─────────────────────────────┐
│ SELL TRIGGER: 4,140 │ ← Red labeled line
└─────────────────────────────┘
▼ 4,120 — First sell target
▼ 4,102 — Secondary target
▼ 4,082 — Tertiary target
▼ 4,050 — Support cluster
▼ 4,040 — Support level
▼ 4,000 — Major psychological support
▼ 3,955 — Deep target
▼ 3,900 — Major support
▼ 3,850 — Extreme bear target
[ SELL SIDE — Red Lines ]
────────────────────────────────────────────────────────────────
SETUP 1 — BUY AT 4,180 (Counter-Trend Long)
────────────────────────────────────────────────────────────────
Entry Zone: $4,180 – $4,185
Stop Loss: Below $4,155 (tight) | Below $4,140 (safe)
Target 1: $4,204 (+$24 / +0.57%)
Target 2: $4,220 (+$40 / +0.95%)
Target 3: $4,244 (+$64 / +1.52%)
Full Target: $4,280+ if momentum returns
R:R Ratio: ~1:1.2 (tight stop) | ~1:1.5 (wide stop)
ANALYSIS:
→ Counter-trend trade against a -6.78% 100-bar downtrend
→ The current 4H candle REJECTED this exact level (opened 4,179,
now trading 4,155) — a clear warning sign
→ Price must reclaim and CLOSE above 4,185 to validate this buy
→ Multiple resistance levels overhead limit upside (4,204 → 4,220
→ 4,244...) — this is a ladder of supply to work through
→ Only valid if price bounces firmly back into the 4,180–4,185
zone with a bullish reversal candle confirmation
→ Phoenix Algo TMA is likely in bearish phase given macro trend
⚡ PROBABILITY OF SUCCESS: ~35%
Reason: Counter-trend setup, fresh rejection from entry zone,
strong overhead supply ladder, bearish macro structure.
High risk without confirmed close above 4,185.
────────────────────────────────────────────────────────────────
SETUP 2 — SELL AT 4,140 (Trend Continuation Short)
────────────────────────────────────────────────────────────────
Entry: $4,140
Stop Loss: Above $4,165 (tight) | Above $4,185 (safe)
Target 1: $4,120 (-$20 / -0.48%)
Target 2: $4,102 (-$38 / -0.92%)
Target 3: $4,082 (-$58 / -1.40%)
Target 4: $4,050 (-$90 / -2.17%)
Target 5: $4,000 (-$140 / -3.38%) ← Major level
Extended: $3,955 → $3,900 → $3,850
R:R Ratio: ~1:1.3 (tight) | ~1:2.5+ (to $4,000)
ANALYSIS:
→ Trend-aligned trade — selling into the continuation of a
confirmed bearish macro move (-6.78% over ~16 days)
→ Current candle opened at 4,179, failed at the buy zone,
and is trending toward 4,140 — price is coming to you
→ Recent 4H bar saw a -65pt bear candle (4,190→4,125) showing
strong sell-side momentum is present
→ Price found temporary support at 4,121 but was unable to
sustain a recovery, rejecting again from 4,179
→ Multiple stacked red support levels below provide clear
profit-taking zones with defined structure
→ $4,000 is the key psychological magnet — likely target if
4,140 breaks and holds
⚡ PROBABILITY OF SUCCESS: ~62%
Reason: Trend-aligned, price approaching from above, bearish
momentum confirmed on recent bars, clear target ladder,
bearish rejection candle forming at Buy 4,180.
────────────────────────────────────────────────────────────────
CRITICAL DECISION POINT — WHAT TO WATCH
────────────────────────────────────────────────────────────────
The next 4H candle CLOSE will determine which setup activates:
► CLOSE ABOVE 4,185 → Buy setup potentially valid
Watch for retest of 4,185 as support
Target 4,204 first
► CLOSE BELOW 4,140 → Sell setup triggers
First target: 4,120
Hold for 4,082 and 4,000
► RANGE 4,140–4,180 → No trade / wait for resolution
Do not force an entry in this zone
────────────────────────────────────────────────────────────────
RISK MANAGEMENT NOTES
────────────────────────────────────────────────────────────────
• Never enter the BUY without a confirmed 4H close above 4,185
• The sell at 4,140 is higher probability but use proper
position sizing — a bounce to 4,185 is still possible
• $4,000 is a major psychological level — expect volatility
and potential reversal near this zone
• Average volume (100 bars): 132,638 — use volume spikes to
confirm breakouts at key levels
• Gold macro drivers (USD strength, yields, risk sentiment)
remain the dominant force — respect the trend
────────────────────────────────────────────────────────────────
SUMMARY SCORECARD
────────────────────────────────────────────────────────────────
Setup Entry Direction Probability
──────────────────────────────────────────────────
Buy (counter-trend) 4,180 LONG ★★☆☆☆ 35%
Sell (with trend) 4,140 SHORT ★★★☆☆ 62%
Overall Bias: BEARISH — favour the sell setup
Best Risk:Reward: Sell 4,140 → Target 4,000 (R:R ~2.5:1)
────────────────────────────────────────────────────────────────
DISCLAIMER
────────────────────────────────────────────────────────────────
This is a technical analysis only. Not financial advice.
Always use a stop loss. Manage your risk per trade.
Past performance of levels does not guarantee future results.
═════════════════════════════════════════════════
XAUUSD (Gold / US Dollar) — 4H CHART ANALYSIS
Trade Idea | Phoenix Algo TMA | Date: 21 June 2026
════════════════════════════════════════════════════════════════
CURRENT PRICE: $4,155.41
TIMEFRAME: 4-Hour
INDICATOR: TMA – Phoenix Algo (The Phoenix v1)
BIAS: BEARISH (macro trend) / CAUTIOUS on counter-trend long
────────────────────────────────────────────────────────────────
OVERVIEW
────────────────────────────────────────────────────────────────
Gold has been in a sustained downtrend over the last 100 bars
(~16 days) on the 4H chart, declining -6.78% from a high of
$4,595.33 down to a current low of $4,023.87. Price is now in a
key decision zone, trading between a marked BUY level at 4,180
and a SELL trigger at 4,140 — a no-man's land of only ~40 pts.
The current 4H candle OPENED at 4,179 (right at the Buy zone),
rejected, and has since fallen to 4,155 — a significant bearish
signal that the buy zone is struggling to hold as support.
────────────────────────────────────────────────────────────────
YOUR MARKED LEVELS — FULL MAP
────────────────────────────────────────────────────────────────
[ BUY SIDE — Green Lines ]
▲ 4,350 — Extended bull target / strong resistance
▲ 4,320 — Resistance cluster
▲ 4,300 — Psychological round number resistance
▲ 4,280 — Prior structure resistance
▲ 4,260 — Resistance level
▲ 4,244 — Resistance level
▲ 4,220 — Resistance level
▲ 4,204 — First overhead resistance
┌─────────────────────────────┐
│ BUY ZONE: 4,180 – 4,185 │ ← Green rectangle / entry box
└─────────────────────────────┘
◉ CURRENT PRICE: $4,155.41 ← Between the two setups
┌─────────────────────────────┐
│ SELL TRIGGER: 4,140 │ ← Red labeled line
└─────────────────────────────┘
▼ 4,120 — First sell target
▼ 4,102 — Secondary target
▼ 4,082 — Tertiary target
▼ 4,050 — Support cluster
▼ 4,040 — Support level
▼ 4,000 — Major psychological support
▼ 3,955 — Deep target
▼ 3,900 — Major support
▼ 3,850 — Extreme bear target
[ SELL SIDE — Red Lines ]
────────────────────────────────────────────────────────────────
SETUP 1 — BUY AT 4,180 (Counter-Trend Long)
────────────────────────────────────────────────────────────────
Entry Zone: $4,180 – $4,185
Stop Loss: Below $4,155 (tight) | Below $4,140 (safe)
Target 1: $4,204 (+$24 / +0.57%)
Target 2: $4,220 (+$40 / +0.95%)
Target 3: $4,244 (+$64 / +1.52%)
Full Target: $4,280+ if momentum returns
R:R Ratio: ~1:1.2 (tight stop) | ~1:1.5 (wide stop)
ANALYSIS:
→ Counter-trend trade against a -6.78% 100-bar downtrend
→ The current 4H candle REJECTED this exact level (opened 4,179,
now trading 4,155) — a clear warning sign
→ Price must reclaim and CLOSE above 4,185 to validate this buy
→ Multiple resistance levels overhead limit upside (4,204 → 4,220
→ 4,244...) — this is a ladder of supply to work through
→ Only valid if price bounces firmly back into the 4,180–4,185
zone with a bullish reversal candle confirmation
→ Phoenix Algo TMA is likely in bearish phase given macro trend
⚡ PROBABILITY OF SUCCESS: ~35%
Reason: Counter-trend setup, fresh rejection from entry zone,
strong overhead supply ladder, bearish macro structure.
High risk without confirmed close above 4,185.
────────────────────────────────────────────────────────────────
SETUP 2 — SELL AT 4,140 (Trend Continuation Short)
────────────────────────────────────────────────────────────────
Entry: $4,140
Stop Loss: Above $4,165 (tight) | Above $4,185 (safe)
Target 1: $4,120 (-$20 / -0.48%)
Target 2: $4,102 (-$38 / -0.92%)
Target 3: $4,082 (-$58 / -1.40%)
Target 4: $4,050 (-$90 / -2.17%)
Target 5: $4,000 (-$140 / -3.38%) ← Major level
Extended: $3,955 → $3,900 → $3,850
R:R Ratio: ~1:1.3 (tight) | ~1:2.5+ (to $4,000)
ANALYSIS:
→ Trend-aligned trade — selling into the continuation of a
confirmed bearish macro move (-6.78% over ~16 days)
→ Current candle opened at 4,179, failed at the buy zone,
and is trending toward 4,140 — price is coming to you
→ Recent 4H bar saw a -65pt bear candle (4,190→4,125) showing
strong sell-side momentum is present
→ Price found temporary support at 4,121 but was unable to
sustain a recovery, rejecting again from 4,179
→ Multiple stacked red support levels below provide clear
profit-taking zones with defined structure
→ $4,000 is the key psychological magnet — likely target if
4,140 breaks and holds
⚡ PROBABILITY OF SUCCESS: ~62%
Reason: Trend-aligned, price approaching from above, bearish
momentum confirmed on recent bars, clear target ladder,
bearish rejection candle forming at Buy 4,180.
────────────────────────────────────────────────────────────────
CRITICAL DECISION POINT — WHAT TO WATCH
────────────────────────────────────────────────────────────────
The next 4H candle CLOSE will determine which setup activates:
► CLOSE ABOVE 4,185 → Buy setup potentially valid
Watch for retest of 4,185 as support
Target 4,204 first
► CLOSE BELOW 4,140 → Sell setup triggers
First target: 4,120
Hold for 4,082 and 4,000
► RANGE 4,140–4,180 → No trade / wait for resolution
Do not force an entry in this zone
────────────────────────────────────────────────────────────────
RISK MANAGEMENT NOTES
────────────────────────────────────────────────────────────────
• Never enter the BUY without a confirmed 4H close above 4,185
• The sell at 4,140 is higher probability but use proper
position sizing — a bounce to 4,185 is still possible
• $4,000 is a major psychological level — expect volatility
and potential reversal near this zone
• Average volume (100 bars): 132,638 — use volume spikes to
confirm breakouts at key levels
• Gold macro drivers (USD strength, yields, risk sentiment)
remain the dominant force — respect the trend
────────────────────────────────────────────────────────────────
SUMMARY SCORECARD
────────────────────────────────────────────────────────────────
Setup Entry Direction Probability
──────────────────────────────────────────────────
Buy (counter-trend) 4,180 LONG ★★☆☆☆ 35%
Sell (with trend) 4,140 SHORT ★★★☆☆ 62%
Overall Bias: BEARISH — favour the sell setup
Best Risk:Reward: Sell 4,140 → Target 4,000 (R:R ~2.5:1)
────────────────────────────────────────────────────────────────
DISCLAIMER
────────────────────────────────────────────────────────────────
This is a technical analysis only. Not financial advice.
Always use a stop loss. Manage your risk per trade.
Past performance of levels does not guarantee future results.
═════════════════════════════════════════════════

Publicaciones relacionadas
Exención de responsabilidad
La información y las publicaciones no constituyen, ni deben considerarse como, asesoramiento o recomendaciones financieras, de inversión, de trading u otro tipo, proporcionadas o respaldadas por TradingView. Obtenga más información en Condiciones de uso.
Publicaciones relacionadas
Exención de responsabilidad
La información y las publicaciones no constituyen, ni deben considerarse como, asesoramiento o recomendaciones financieras, de inversión, de trading u otro tipo, proporcionadas o respaldadas por TradingView. Obtenga más información en Condiciones de uso.