
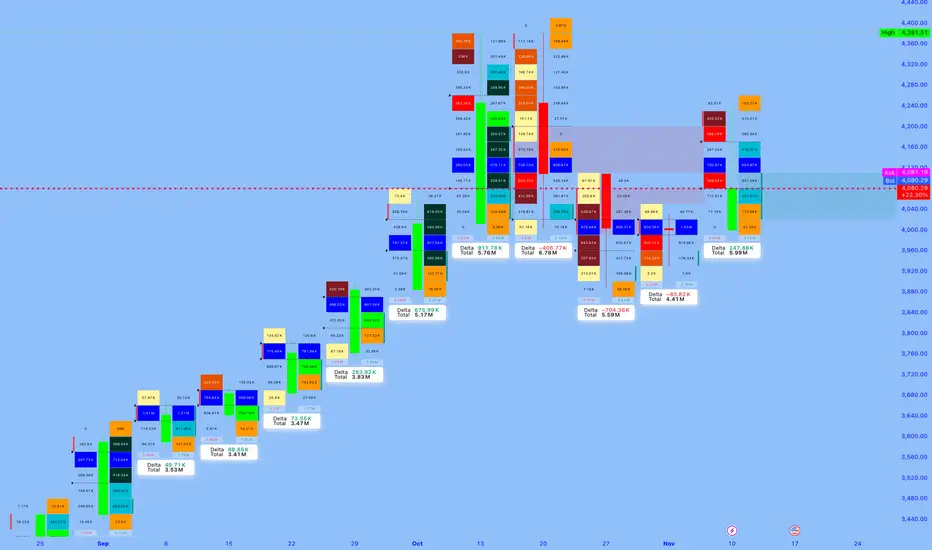
📘 YALLA XAUMO — GOLD (XAUUSD)
Institutional WEEKLY — COMPREHENSIVE OUTLOOK
Week of Mon 17 → Fri 21 Nov 2025
All times Africa/Cairo (UTC+2). EDUCATIONAL ONLY — NOT FINANCIAL ADVICE.
Spot ref (XAUUSD): ~4,080 $/oz
GC1 (Dec ’25, front month): ~4,184 $/oz
GC2 (Feb ’26, next): ~4,220 $/oz
Term spread (GC2–GC1): ≈ +0.9% → mild CONTANGO
────────────────────────────────
GC FUTURES CURVE — QUICK GUIDE
────────────────────────────────
• Contango → GC2 > GC1 (upward curve):
Normal structure. Storage + carry costs are priced in. This is NOT automatically bearish for gold.
• Backwardation → GC2 < GC1 (downward curve):
Often signals strong immediate demand or short-term supply/flow stress. Can be short-term bullish for spot.
• Term spread (%) → (GC2 − GC1) / GC1 × 100:
Shows how steep the futures curve is. Bigger positive spread = market pricing more “future upside / carry”. Narrow or negative spread = nearer-term stress or demand.
Current read: Mild, healthy contango → gold is expensive but NOT in panic backwardation; market still comfortable holding exposure into early 2026.
────────────────────────
0) WEEKLY SNAPSHOT & MAP
────────────────────────
• Big picture:
– Gold is trading just below recent all-time highs (above 4,200 printed last month).
– Past month: soft pullback of roughly −3% from highs but still very elevated on a multi-year basis.
– Last 5–7 sessions: strong two-way flow, with intraday spikes both directions and closes clustering ~4,050–4,150.
• XAUMO structural read:
– Below: multi-week “Uploading” zone (institutional accumulation) where prior dips were bought aggressively.
– Above: fresh “Offloading” zone close to the recent record highs where large players started distributing size into strength.
– Vol & spreads:
• Volatility remains high but off the absolute peak.
• Spreads and intraday ranges expanded mid-week and cooled slightly into Friday.
→ Interpretation for 17–21 Nov:
• This is a “decision week inside a high range”, not a clean new trend.
• Market will likely choose between:
– (A) Deeper rotation back into the Uploading zone if macro = hawkish / growth-OK, or
– (B) A second push toward or beyond the highs if macro = dovish / growth-scared.
────────────────────────────
1) CROSS-ASSET TAPE (RISK MAP)
────────────────────────────
• Dollar Index (DXY) ~99.2:
– Off its mid-year peaks, closer to the bottom of its recent range.
– Bias: mild dollar softness compared to earlier in 2025.
• S&P 500 ~6,734:
– Near record territory but with recent pullbacks and intraday volatility.
– Investors still “buying the dip” in AI/tech, but sensitivity to Fed signals is high.
• VIX ~19–20:
– Elevated vs “calm” (12–15), but below panic (>25).
– Tells you: this is a market that can accelerate on headlines; gold benefits from that volatility.
• US 10-year yield ~4.1–4.2%:
– Still high in historical terms.
– Polls/forecasts show expectations for only modest moves higher in coming months, with cuts further out on the curve.
– Gold is coexisting with high nominal yields thanks to:
• Debasement narrative (debt, deficits),
• Central-bank buying,
• Uncertainty about real growth.
→ XAUMO conclusion:
– Cross-asset tape is mildly risk-on but fragile.
– Any surprise in Fed tone, data, or geopolitical risk can flip the intraday regime quickly and feed into gold.
──────────────────────────────
2) MACRO CALENDAR: 17–23 NOV
──────────────────────────────
Focus: what can MOVE gold, not every minor data point.
MON 17 NOV
• CAD CPI (inflation, Canada)
– Direct on CAD, indirect on commodities risk sentiment.
– Bigger-than-expected upside surprise can revive “sticky inflation” narrative.
TUE 18 NOV
• RBA Meeting Minutes (Australia)
– Asia-Pac risk sentiment signal.
– Dovish tone → supportive for gold via weaker AUD yields / global growth worries.
– Hawkish tone → limited direct effect but can tilt Asia risk-on.
WED 19 NOV — KEY DAY
• FOMC Minutes (October meeting)
– The main event of the week for gold.
– Market will scan for:
– How split is the committee?
– How worried about inflation vs growth?
– Hints about timing/pace of future cuts into 2026.
– Less hawkish / more growth-worry:
→ Bond yields ease, dollar softens → supportive for gold.
– More hawkish / inflation-worry:
→ Yields nudge higher, dollar firmer → pressure on gold (at least initially).
THU 20 NOV
• PBoC rate decision / China credit stance
– Extra easing / credit support = better commodity demand narrative (indirect positive for gold).
– Disappointment or more signs of slowdown = risk-off in cyclicals, but can also support gold as safe haven if sentiment sours.
FRI 21 NOV
• UK Retail Sales
• Flash PMIs (Germany, Eurozone, UK, US)
– Global growth thermometer.
– Weak PMIs → recession / stagnation chatter → more medium-term support for gold (cuts + safe-haven flows).
– Strong PMIs → short-term support for equities and possibly the dollar → can cap gold near the top of its range.
SUN 23 NOV (outside main trading week)
• NZ Retail Sales
– Minor for gold directly, but part of the global growth mosaic.
──────────────────────────────
3) HOLIDAYS / LIQUIDITY CHECK
──────────────────────────────
• No major US federal holiday during 17–21 Nov.
• Thanksgiving is on Thu 28 Nov (the following week), with Black Friday 28–29 Nov.
• Europe: no major pan-EU market holiday in this week; only usual local events with limited impact on global liquidity.
→ Read: This is a full-liquidity week. Moves around FOMC Minutes and PMIs are likely to be “real” flows, not just holiday noise.
────────────────────────────────────
4) XAUMO STRUCTURE — RANGE DIAGNOSTIC
────────────────────────────────────
(Conceptual: Uploading vs Offloading, MegaBars & Delta behavior)
• Uploading zones (support side):
– Built over recent weeks on pullbacks after the run to ~4,200+.
– Characterized by:
• Positive volume delta on down days,
• Strong reaction candles (MegaBars) stopping selloffs,
• RVOL elevated on lows (buyers stepping in).
– Each revisit has so far triggered a bounce, reinforcing these zones as “dynamic institutional support”.
• Offloading zones (resistance side):
– Close to or slightly above the recent record highs.
– Features:
• RVOL spikes on up-swings with fading delta (distributions into strength),
• Rejection candles / Kill Bars,
• Choppy clusters where upside follow-through stalls.
– This behavior is classic “distribute at extremes”, not clean breakout acceleration.
• Volatility regime:
– Elevated but not parabolic.
– XAUMO view: we are in a “high-altitude balancing act”:
→ deep pockets are carefully rotating risk at high prices, not simply panic-buying or panic-selling.
──────────────────────────────
5) WEEKLY REGIME (TREND VS BALANCE)
──────────────────────────────
High-level trend (multi-TF conceptually):
• Monthly:
– Strong bullish secular trend still intact (structure higher highs/higher lows).
– Over-extended zone; any deep pullback is still “inside” a long-term uptrend unless key prior monthly lows break.
• Weekly:
– Price is at/just below prior extremes with a broad horizontal band forming (multi-week range).
– XAUMO reads this as:
“Distribution-and-re-accumulation at high altitude” — not confirmed reversal, not confirmed blow-off continuation.
• Daily:
– Alternation: sharp pushes up followed by sharp shake-outs.
– Choppy value re-tests near the middle of the weekly range between Uploading and Offloading.
→ Regime label for 17–21 Nov:
“High-level BALANCED with directional optionality around FOMC Minutes.”
In other words: the trend is up on big TFs, but this week is about “who wins the range”: buyers defending Uploading vs sellers leaning on Offloading.
──────────────────────────────
6) WEEKLY SCENARIO LAB (NO ENTRIES)
──────────────────────────────
⚠ These are structural scenarios for study ONLY — NOT trade signals, no entries, no SL/TP.
SCENARIO A — “Dip then Reload” (Pro-gold bias)
• Setup:
– Early week: gold drifts lower or chops sideways as markets front-run FOMC Minutes.
– We see tests toward/into known Uploading zones on your XAUMO map.
• FOMC tone:
– Less hawkish / more concerned about growth and debt sustainability.
• Market reaction:
– US yields ease a bit, DXY softens.
– Gold prints supportive delta + MegaBars from the lower half of the range.
• Outcome:
– Week closes towards mid-to-upper portion of the recent band.
– Under this scenario, dips are “used to reload” rather than start a full reversal.
SCENARIO B — “Fed Hawkish Squeeze” (Pressure on gold)
• Setup:
– Markets go into Wednesday still near mid or upper band of the recent range.
• FOMC tone:
– Minutes show more concern about inflation, less urgency about cuts.
• Market reaction:
– 10-year yields push higher again; dollar stabilizes or firms.
– Equities wobble or correct.
– Gold fails to hold mid-range value and rotates back firmly toward the lower band.
• Outcome:
– Week prints a bearish body on weekly candle (longer upper wick), with tests or even temporary breaks beneath recent Uploading zones.
– This doesn’t kill the long-term bull but warns of deeper corrective structure into late November.
SCENARIO C — “Risk-On Sideways” (Range extension without decision)
• Setup:
– PMIs and data come in “OK but not scary”,
– FOMC Minutes are balanced, nothing shockingly new.
• Market reaction:
– Equities stay near highs with some volatility,
– Dollar only slightly moved,
– Gold oscillates between Uploading and Offloading with no decisive break.
• Outcome:
– Another wide range weekly candle closes inside the same band.
– XAUMO takeaway: continuing accumulation/distribution at altitude; bigger move postponed to December or post-Thanksgiving.
SCENARIO D — TAIL RISK (Shock event)
• Could be:
– Geopolitical flare-up,
– Surprise credit event,
– Major policy misstep headline.
• Reaction:
– Spiky MegaBars, large RVOL, fast repricing across DXY, yields, and equities.
– XAUMO focus shifts from “fine-tuning the range” to:
• Identifying NEW Uploading/Offloading zones created by the shock.
──────────────────────────────
7) XAUMO WEEKLY EXECUTION CHECKLIST
──────────────────────────────
Use this to structure your own plan (NOT to auto-trade):
BEFORE MONDAY OPEN:
[ ] Mark your key Uploading zones (multi-week support clusters).
[ ] Mark your key Offloading zones (multi-week distribution caps).
[ ] Note the middle of the recent range — where “fair value” has been trading.
EACH DAY (PRE-LONDON):
[ ] Review overnight Asia flows:
– Did Tokyo/Asia buy dips or sell rallies?
– Any unusual RVOL / MegaBar activity?
[ ] Check macro diary for the day (is it event-driven or purely technical?).
PRE-NEW YORK (ESPECIALLY WED FOMC DAY):
[ ] Re-assess:
– Is gold closer to Uploading or Offloading?
– Are DXY, SPX, and US10Y aligned with risk-on or risk-off?
[ ] Decide which scenario (A/B/C/D) the market is closer to and what would invalidate that read.
END OF WEEK:
[ ] Where did the weekly close land?
– Near highs → Offloading challenged or absorbed.
– Near lows → Uploading stressed or broken.
– Middle → range still dominant.
[ ] Update your XAUMO Gate Map and redraw your higher-TF structure for the final weeks of Q4.
──────────────────────────────
BOTTOM LINE FOR THE WEEK
──────────────────────────────
• Environment:
– Gold is in a high-altitude balance: big secular bull, but stuck between institutional Uploading and Offloading zones.
– FOMC Minutes + global PMIs are the main catalysts for a range break or confirmation of continued balancing.
• Practical XAUMO message:
– Respect BOTH tails: a dovish surprise can fuel another push toward the highs, a hawkish surprise can drive a deeper retest of support.
– Instead of predicting, let structure + volume + delta + sessions show you:
“Where are they loading the truck?” vs “Where are they unloading it?”
This whole report is for education, orientation, and planning —
not for executing trades, not a substitute for your own risk management,
================================
📘 EDUCATIONAL PRECISION MAP — XAUUSD (Next Week)
Reference spot (Fri close): ~4,080 $/oz
Recent extremes: low ~4,032 • highs ~4,215–4,250
⚠️ Not signals. Use as study levels only. You own your risk.
────────────────────────
1) “Shallow Dip” Accumulation Study
────────────────────────
Idea: market defends Friday’s lower zone and re-loads above 4,030.
• Study ENTRY zone (buyers to watch):
→ 4,040 – 4,065
(just above the 4,032 low and round 4,050 handle)
• STRUCTURAL invalidation for this idea:
→ H4 close below 4,010
(means that whole shallow support band failed, attention shifts to deeper zone).
• EDUCATIONAL targets if this zone holds:
→ TP1 (mid-range): 4,120 – 4,135
(recent intraday balance / minor resistance)
→ TP2 (upper band test): 4,170 – 4,190
(cluster of recent daily closes / resistances)
Risk logic: once you’re under 4,010, you’re no longer trading a “shallow dip”; you’re in deep-correction territory.
────────────────────────
2) “Deep Dip” Accumulation Study
────────────────────────
Idea: shallow zone fails, market washes into the bigger structural support around 4,000.
• Study ENTRY zone:
→ 3,980 – 4,005
(psychological 4,000 + early-November lows near 4,004–4,005)
• STRUCTURAL invalidation:
→ Daily close below 3,950
(breaks prior swing structure; opens room toward mid-3,800s mentioned in some forecasts).
• EDUCATIONAL targets if that zone absorbs selling:
→ TP1: 4,060 – 4,080 (back to value / ref area)
→ TP2: 4,120 – 4,140 (same mid-range resistance as in Scenario 1).
Risk logic: below 3,950 you’re no longer “buying a dip in a strong trend”, you’re in candidate trend-change.
────────────────────────
3) “Offloading Fade” — Range Sell Study
────────────────────────
Idea: big players keep distributing into strength near last week’s cap.
• Study ENTRY zone (sellers to watch):
→ 4,185 – 4,215
(recent daily closes and intraday caps; multiple analyses flag 4,203–4,219 as key resistance)
• STRUCTURAL invalidation:
→ H4 close above 4,245
(clears the rejection high / wick zone ~4,245–4,250).
• EDUCATIONAL downside targets if sellers defend:
→ TP1: 4,140 – 4,150
(recent support/flip area before Friday’s drop)
→ TP2: 4,080 – 4,095
(current reference / Friday settlement band).
Risk logic: if price accepts above 4,245 on closing basis, this “fade the top” idea is dead — you’re on the wrong side of a breakout.
────────────────────────
4) “Breakout & Hold” Continuation Study
────────────────────────
Idea: market finally accepts above the rejection band and builds a new leg higher.
• Trigger condition (not entry by itself):
→ H4 / Daily close above 4,245 with RVOL > 1 and no immediate full rejection.
• Study ENTRY zone (post-break retest):
→ 4,230 – 4,245
(retest of broken resistance as support).
• STRUCTURAL invalidation:
→ Close back inside / below 4,200
(failed breakout → bull trap, reverts to range or reversal).
• EDUCATIONAL upside targets:
→ TP1: 4,285 – 4,300
(next projected resistance band from current S/R ladders).
→ TP2: 4,325 – 4,350
(extension based on recent daily ranges ~170–200 $/oz added above 4,170–4,190).
Risk logic: if the breakout can’t hold 4,200 on a retest, treat it as distribution, not continuation.
────────────────────────
How to actually USE this (educationally)
────────────────────────
1) Mark the four zones on your chart:
• 4,040–4,065
• 3,980–4,005
• 4,185–4,215
• 4,230–4,245
2) For each touch next week, ask:
• What is volume doing (normal / high RVOL / drying up)?
• What is delta doing (aggressive buyers or sellers taking control)?
• Are DXY and 10Y yields confirming the move or fading it?
3) Only THEN design your own trade plan (or stay flat).
These levels are a **map**, not orders.
🏆 Winners trade with XAUMO indicators
EDUCATIONAL ONLY — NOT FINANCIAL ADVICE.
Institutional WEEKLY — COMPREHENSIVE OUTLOOK
Week of Mon 17 → Fri 21 Nov 2025
All times Africa/Cairo (UTC+2). EDUCATIONAL ONLY — NOT FINANCIAL ADVICE.
Spot ref (XAUUSD): ~4,080 $/oz
GC1 (Dec ’25, front month): ~4,184 $/oz
GC2 (Feb ’26, next): ~4,220 $/oz
Term spread (GC2–GC1): ≈ +0.9% → mild CONTANGO
────────────────────────────────
GC FUTURES CURVE — QUICK GUIDE
────────────────────────────────
• Contango → GC2 > GC1 (upward curve):
Normal structure. Storage + carry costs are priced in. This is NOT automatically bearish for gold.
• Backwardation → GC2 < GC1 (downward curve):
Often signals strong immediate demand or short-term supply/flow stress. Can be short-term bullish for spot.
• Term spread (%) → (GC2 − GC1) / GC1 × 100:
Shows how steep the futures curve is. Bigger positive spread = market pricing more “future upside / carry”. Narrow or negative spread = nearer-term stress or demand.
Current read: Mild, healthy contango → gold is expensive but NOT in panic backwardation; market still comfortable holding exposure into early 2026.
────────────────────────
0) WEEKLY SNAPSHOT & MAP
────────────────────────
• Big picture:
– Gold is trading just below recent all-time highs (above 4,200 printed last month).
– Past month: soft pullback of roughly −3% from highs but still very elevated on a multi-year basis.
– Last 5–7 sessions: strong two-way flow, with intraday spikes both directions and closes clustering ~4,050–4,150.
• XAUMO structural read:
– Below: multi-week “Uploading” zone (institutional accumulation) where prior dips were bought aggressively.
– Above: fresh “Offloading” zone close to the recent record highs where large players started distributing size into strength.
– Vol & spreads:
• Volatility remains high but off the absolute peak.
• Spreads and intraday ranges expanded mid-week and cooled slightly into Friday.
→ Interpretation for 17–21 Nov:
• This is a “decision week inside a high range”, not a clean new trend.
• Market will likely choose between:
– (A) Deeper rotation back into the Uploading zone if macro = hawkish / growth-OK, or
– (B) A second push toward or beyond the highs if macro = dovish / growth-scared.
────────────────────────────
1) CROSS-ASSET TAPE (RISK MAP)
────────────────────────────
• Dollar Index (DXY) ~99.2:
– Off its mid-year peaks, closer to the bottom of its recent range.
– Bias: mild dollar softness compared to earlier in 2025.
• S&P 500 ~6,734:
– Near record territory but with recent pullbacks and intraday volatility.
– Investors still “buying the dip” in AI/tech, but sensitivity to Fed signals is high.
• VIX ~19–20:
– Elevated vs “calm” (12–15), but below panic (>25).
– Tells you: this is a market that can accelerate on headlines; gold benefits from that volatility.
• US 10-year yield ~4.1–4.2%:
– Still high in historical terms.
– Polls/forecasts show expectations for only modest moves higher in coming months, with cuts further out on the curve.
– Gold is coexisting with high nominal yields thanks to:
• Debasement narrative (debt, deficits),
• Central-bank buying,
• Uncertainty about real growth.
→ XAUMO conclusion:
– Cross-asset tape is mildly risk-on but fragile.
– Any surprise in Fed tone, data, or geopolitical risk can flip the intraday regime quickly and feed into gold.
──────────────────────────────
2) MACRO CALENDAR: 17–23 NOV
──────────────────────────────
Focus: what can MOVE gold, not every minor data point.
MON 17 NOV
• CAD CPI (inflation, Canada)
– Direct on CAD, indirect on commodities risk sentiment.
– Bigger-than-expected upside surprise can revive “sticky inflation” narrative.
TUE 18 NOV
• RBA Meeting Minutes (Australia)
– Asia-Pac risk sentiment signal.
– Dovish tone → supportive for gold via weaker AUD yields / global growth worries.
– Hawkish tone → limited direct effect but can tilt Asia risk-on.
WED 19 NOV — KEY DAY
• FOMC Minutes (October meeting)
– The main event of the week for gold.
– Market will scan for:
– How split is the committee?
– How worried about inflation vs growth?
– Hints about timing/pace of future cuts into 2026.
– Less hawkish / more growth-worry:
→ Bond yields ease, dollar softens → supportive for gold.
– More hawkish / inflation-worry:
→ Yields nudge higher, dollar firmer → pressure on gold (at least initially).
THU 20 NOV
• PBoC rate decision / China credit stance
– Extra easing / credit support = better commodity demand narrative (indirect positive for gold).
– Disappointment or more signs of slowdown = risk-off in cyclicals, but can also support gold as safe haven if sentiment sours.
FRI 21 NOV
• UK Retail Sales
• Flash PMIs (Germany, Eurozone, UK, US)
– Global growth thermometer.
– Weak PMIs → recession / stagnation chatter → more medium-term support for gold (cuts + safe-haven flows).
– Strong PMIs → short-term support for equities and possibly the dollar → can cap gold near the top of its range.
SUN 23 NOV (outside main trading week)
• NZ Retail Sales
– Minor for gold directly, but part of the global growth mosaic.
──────────────────────────────
3) HOLIDAYS / LIQUIDITY CHECK
──────────────────────────────
• No major US federal holiday during 17–21 Nov.
• Thanksgiving is on Thu 28 Nov (the following week), with Black Friday 28–29 Nov.
• Europe: no major pan-EU market holiday in this week; only usual local events with limited impact on global liquidity.
→ Read: This is a full-liquidity week. Moves around FOMC Minutes and PMIs are likely to be “real” flows, not just holiday noise.
────────────────────────────────────
4) XAUMO STRUCTURE — RANGE DIAGNOSTIC
────────────────────────────────────
(Conceptual: Uploading vs Offloading, MegaBars & Delta behavior)
• Uploading zones (support side):
– Built over recent weeks on pullbacks after the run to ~4,200+.
– Characterized by:
• Positive volume delta on down days,
• Strong reaction candles (MegaBars) stopping selloffs,
• RVOL elevated on lows (buyers stepping in).
– Each revisit has so far triggered a bounce, reinforcing these zones as “dynamic institutional support”.
• Offloading zones (resistance side):
– Close to or slightly above the recent record highs.
– Features:
• RVOL spikes on up-swings with fading delta (distributions into strength),
• Rejection candles / Kill Bars,
• Choppy clusters where upside follow-through stalls.
– This behavior is classic “distribute at extremes”, not clean breakout acceleration.
• Volatility regime:
– Elevated but not parabolic.
– XAUMO view: we are in a “high-altitude balancing act”:
→ deep pockets are carefully rotating risk at high prices, not simply panic-buying or panic-selling.
──────────────────────────────
5) WEEKLY REGIME (TREND VS BALANCE)
──────────────────────────────
High-level trend (multi-TF conceptually):
• Monthly:
– Strong bullish secular trend still intact (structure higher highs/higher lows).
– Over-extended zone; any deep pullback is still “inside” a long-term uptrend unless key prior monthly lows break.
• Weekly:
– Price is at/just below prior extremes with a broad horizontal band forming (multi-week range).
– XAUMO reads this as:
“Distribution-and-re-accumulation at high altitude” — not confirmed reversal, not confirmed blow-off continuation.
• Daily:
– Alternation: sharp pushes up followed by sharp shake-outs.
– Choppy value re-tests near the middle of the weekly range between Uploading and Offloading.
→ Regime label for 17–21 Nov:
“High-level BALANCED with directional optionality around FOMC Minutes.”
In other words: the trend is up on big TFs, but this week is about “who wins the range”: buyers defending Uploading vs sellers leaning on Offloading.
──────────────────────────────
6) WEEKLY SCENARIO LAB (NO ENTRIES)
──────────────────────────────
⚠ These are structural scenarios for study ONLY — NOT trade signals, no entries, no SL/TP.
SCENARIO A — “Dip then Reload” (Pro-gold bias)
• Setup:
– Early week: gold drifts lower or chops sideways as markets front-run FOMC Minutes.
– We see tests toward/into known Uploading zones on your XAUMO map.
• FOMC tone:
– Less hawkish / more concerned about growth and debt sustainability.
• Market reaction:
– US yields ease a bit, DXY softens.
– Gold prints supportive delta + MegaBars from the lower half of the range.
• Outcome:
– Week closes towards mid-to-upper portion of the recent band.
– Under this scenario, dips are “used to reload” rather than start a full reversal.
SCENARIO B — “Fed Hawkish Squeeze” (Pressure on gold)
• Setup:
– Markets go into Wednesday still near mid or upper band of the recent range.
• FOMC tone:
– Minutes show more concern about inflation, less urgency about cuts.
• Market reaction:
– 10-year yields push higher again; dollar stabilizes or firms.
– Equities wobble or correct.
– Gold fails to hold mid-range value and rotates back firmly toward the lower band.
• Outcome:
– Week prints a bearish body on weekly candle (longer upper wick), with tests or even temporary breaks beneath recent Uploading zones.
– This doesn’t kill the long-term bull but warns of deeper corrective structure into late November.
SCENARIO C — “Risk-On Sideways” (Range extension without decision)
• Setup:
– PMIs and data come in “OK but not scary”,
– FOMC Minutes are balanced, nothing shockingly new.
• Market reaction:
– Equities stay near highs with some volatility,
– Dollar only slightly moved,
– Gold oscillates between Uploading and Offloading with no decisive break.
• Outcome:
– Another wide range weekly candle closes inside the same band.
– XAUMO takeaway: continuing accumulation/distribution at altitude; bigger move postponed to December or post-Thanksgiving.
SCENARIO D — TAIL RISK (Shock event)
• Could be:
– Geopolitical flare-up,
– Surprise credit event,
– Major policy misstep headline.
• Reaction:
– Spiky MegaBars, large RVOL, fast repricing across DXY, yields, and equities.
– XAUMO focus shifts from “fine-tuning the range” to:
• Identifying NEW Uploading/Offloading zones created by the shock.
──────────────────────────────
7) XAUMO WEEKLY EXECUTION CHECKLIST
──────────────────────────────
Use this to structure your own plan (NOT to auto-trade):
BEFORE MONDAY OPEN:
[ ] Mark your key Uploading zones (multi-week support clusters).
[ ] Mark your key Offloading zones (multi-week distribution caps).
[ ] Note the middle of the recent range — where “fair value” has been trading.
EACH DAY (PRE-LONDON):
[ ] Review overnight Asia flows:
– Did Tokyo/Asia buy dips or sell rallies?
– Any unusual RVOL / MegaBar activity?
[ ] Check macro diary for the day (is it event-driven or purely technical?).
PRE-NEW YORK (ESPECIALLY WED FOMC DAY):
[ ] Re-assess:
– Is gold closer to Uploading or Offloading?
– Are DXY, SPX, and US10Y aligned with risk-on or risk-off?
[ ] Decide which scenario (A/B/C/D) the market is closer to and what would invalidate that read.
END OF WEEK:
[ ] Where did the weekly close land?
– Near highs → Offloading challenged or absorbed.
– Near lows → Uploading stressed or broken.
– Middle → range still dominant.
[ ] Update your XAUMO Gate Map and redraw your higher-TF structure for the final weeks of Q4.
──────────────────────────────
BOTTOM LINE FOR THE WEEK
──────────────────────────────
• Environment:
– Gold is in a high-altitude balance: big secular bull, but stuck between institutional Uploading and Offloading zones.
– FOMC Minutes + global PMIs are the main catalysts for a range break or confirmation of continued balancing.
• Practical XAUMO message:
– Respect BOTH tails: a dovish surprise can fuel another push toward the highs, a hawkish surprise can drive a deeper retest of support.
– Instead of predicting, let structure + volume + delta + sessions show you:
“Where are they loading the truck?” vs “Where are they unloading it?”
This whole report is for education, orientation, and planning —
not for executing trades, not a substitute for your own risk management,
================================
📘 EDUCATIONAL PRECISION MAP — XAUUSD (Next Week)
Reference spot (Fri close): ~4,080 $/oz
Recent extremes: low ~4,032 • highs ~4,215–4,250
⚠️ Not signals. Use as study levels only. You own your risk.
────────────────────────
1) “Shallow Dip” Accumulation Study
────────────────────────
Idea: market defends Friday’s lower zone and re-loads above 4,030.
• Study ENTRY zone (buyers to watch):
→ 4,040 – 4,065
(just above the 4,032 low and round 4,050 handle)
• STRUCTURAL invalidation for this idea:
→ H4 close below 4,010
(means that whole shallow support band failed, attention shifts to deeper zone).
• EDUCATIONAL targets if this zone holds:
→ TP1 (mid-range): 4,120 – 4,135
(recent intraday balance / minor resistance)
→ TP2 (upper band test): 4,170 – 4,190
(cluster of recent daily closes / resistances)
Risk logic: once you’re under 4,010, you’re no longer trading a “shallow dip”; you’re in deep-correction territory.
────────────────────────
2) “Deep Dip” Accumulation Study
────────────────────────
Idea: shallow zone fails, market washes into the bigger structural support around 4,000.
• Study ENTRY zone:
→ 3,980 – 4,005
(psychological 4,000 + early-November lows near 4,004–4,005)
• STRUCTURAL invalidation:
→ Daily close below 3,950
(breaks prior swing structure; opens room toward mid-3,800s mentioned in some forecasts).
• EDUCATIONAL targets if that zone absorbs selling:
→ TP1: 4,060 – 4,080 (back to value / ref area)
→ TP2: 4,120 – 4,140 (same mid-range resistance as in Scenario 1).
Risk logic: below 3,950 you’re no longer “buying a dip in a strong trend”, you’re in candidate trend-change.
────────────────────────
3) “Offloading Fade” — Range Sell Study
────────────────────────
Idea: big players keep distributing into strength near last week’s cap.
• Study ENTRY zone (sellers to watch):
→ 4,185 – 4,215
(recent daily closes and intraday caps; multiple analyses flag 4,203–4,219 as key resistance)
• STRUCTURAL invalidation:
→ H4 close above 4,245
(clears the rejection high / wick zone ~4,245–4,250).
• EDUCATIONAL downside targets if sellers defend:
→ TP1: 4,140 – 4,150
(recent support/flip area before Friday’s drop)
→ TP2: 4,080 – 4,095
(current reference / Friday settlement band).
Risk logic: if price accepts above 4,245 on closing basis, this “fade the top” idea is dead — you’re on the wrong side of a breakout.
────────────────────────
4) “Breakout & Hold” Continuation Study
────────────────────────
Idea: market finally accepts above the rejection band and builds a new leg higher.
• Trigger condition (not entry by itself):
→ H4 / Daily close above 4,245 with RVOL > 1 and no immediate full rejection.
• Study ENTRY zone (post-break retest):
→ 4,230 – 4,245
(retest of broken resistance as support).
• STRUCTURAL invalidation:
→ Close back inside / below 4,200
(failed breakout → bull trap, reverts to range or reversal).
• EDUCATIONAL upside targets:
→ TP1: 4,285 – 4,300
(next projected resistance band from current S/R ladders).
→ TP2: 4,325 – 4,350
(extension based on recent daily ranges ~170–200 $/oz added above 4,170–4,190).
Risk logic: if the breakout can’t hold 4,200 on a retest, treat it as distribution, not continuation.
────────────────────────
How to actually USE this (educationally)
────────────────────────
1) Mark the four zones on your chart:
• 4,040–4,065
• 3,980–4,005
• 4,185–4,215
• 4,230–4,245
2) For each touch next week, ask:
• What is volume doing (normal / high RVOL / drying up)?
• What is delta doing (aggressive buyers or sellers taking control)?
• Are DXY and 10Y yields confirming the move or fading it?
3) Only THEN design your own trade plan (or stay flat).
These levels are a **map**, not orders.
🏆 Winners trade with XAUMO indicators
EDUCATIONAL ONLY — NOT FINANCIAL ADVICE.

لو عايز تبقى واحد من اللي بيفهموا في الدهب وبيكسبوا من السوق صح،
🎯 للدهب والفرص الحقيقية تابعنا من هنا:
For gold updates & smart trades 👇
t.me/+kEj0YpkDJlA1YWM0
You're welcome to join my Telegram channel
انضم وابقى من اللعيبة مش من الجمهور
🎯 للدهب والفرص الحقيقية تابعنا من هنا:
For gold updates & smart trades 👇
t.me/+kEj0YpkDJlA1YWM0
You're welcome to join my Telegram channel
انضم وابقى من اللعيبة مش من الجمهور
Publicaciones relacionadas
Exención de responsabilidad
La información y las publicaciones no constituyen, ni deben considerarse como, asesoramiento o recomendaciones financieras, de inversión, de trading u otro tipo, proporcionadas o respaldadas por TradingView. Obtenga más información en Condiciones de uso.
لو عايز تبقى واحد من اللي بيفهموا في الدهب وبيكسبوا من السوق صح،
🎯 للدهب والفرص الحقيقية تابعنا من هنا:
For gold updates & smart trades 👇
t.me/+kEj0YpkDJlA1YWM0
You're welcome to join my Telegram channel
انضم وابقى من اللعيبة مش من الجمهور
🎯 للدهب والفرص الحقيقية تابعنا من هنا:
For gold updates & smart trades 👇
t.me/+kEj0YpkDJlA1YWM0
You're welcome to join my Telegram channel
انضم وابقى من اللعيبة مش من الجمهور
Publicaciones relacionadas
Exención de responsabilidad
La información y las publicaciones no constituyen, ni deben considerarse como, asesoramiento o recomendaciones financieras, de inversión, de trading u otro tipo, proporcionadas o respaldadas por TradingView. Obtenga más información en Condiciones de uso.