
XAUUSD: Potential Bearish Reversal from 4H Fair Value Gap (FVG)
Key Observations and Analysis
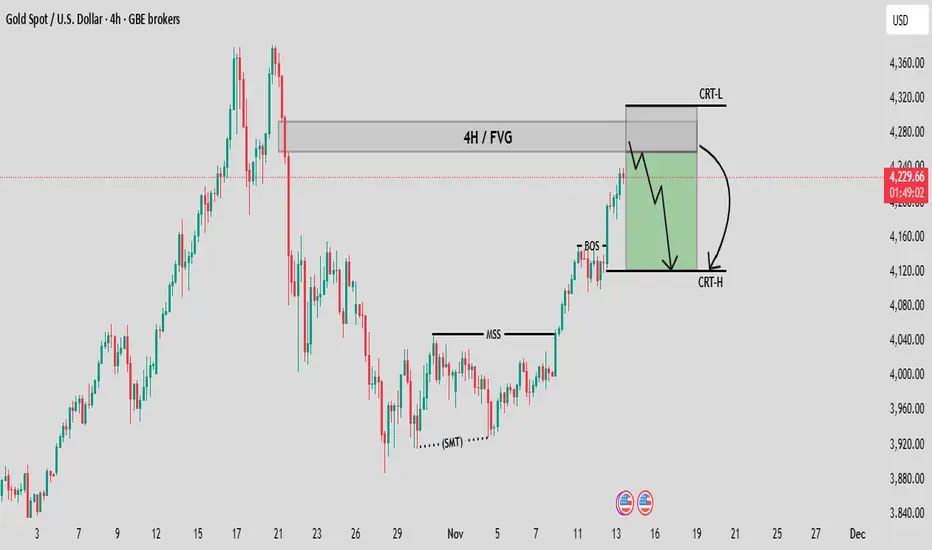
Recent Market Structure: The price action showed signs of accumulation near the lows (indicated by the (SMT) or Smart Money Trap/Swing point) and then broke a previous swing high (marked as MSS or Market Structure Shift), confirming a strong shift to a bullish trend recently.
Impulsive Rally and Break of Structure (BOS): The strong upward movement created new highs and broke a previous resistance level (marked as BOS or Break of Structure), confirming the continuation of the short-term bullish momentum.
The 4H Fair Value Gap (4H / FVG): The large gray shaded rectangle is labeled as a 4H / FVG (Fair Value Gap), also sometimes referred to as an Imbalance. This is an area where the market moved very quickly, leaving a price inefficiency (a gap between the high/low of specific candles). These gaps are often viewed as magnets that the price will return to in order to "fill" or "mitigate" the inefficiency before continuing its trend or reversing.
Bearish Scenario (The Setup):
The price has aggressively moved up and is currently near the lower boundary of the 4H / FVG.
The setup suggests a Contraction (CRT) phase. The high of this potential contraction is labeled CRT-L (Contraction Low, but likely indicating the upper boundary of the trade range).
The large green arrow shows the anticipated move: a reversal upon entering or touching the FVG/Supply Zone, leading to a move down to target the recent low of the strong rally (labeled CRT-H, indicating the high of the previous move/target low).
The target for the potential retracement is the area around the previous BOS level and the swing low that initiated the final push, around $4,120.00.
Interpretation: The chart suggests that the recent strong rally might be due for a deep retracement or even a short-term reversal, as the price is entering a potential supply/distribution zone created by the Fair Value Gap.
Conclusion
The chart presents a trade idea based on the mitigation of the 4H Fair Value Gap. A bearish entry is anticipated once the price fully enters the FVG, with the aim of capturing the move back down to the recent structure low (CRT-H). This is a common setup in SMC analysis, expecting the market to re-balance before the next major move.
Recent Market Structure: The price action showed signs of accumulation near the lows (indicated by the (SMT) or Smart Money Trap/Swing point) and then broke a previous swing high (marked as MSS or Market Structure Shift), confirming a strong shift to a bullish trend recently.
Impulsive Rally and Break of Structure (BOS): The strong upward movement created new highs and broke a previous resistance level (marked as BOS or Break of Structure), confirming the continuation of the short-term bullish momentum.
The 4H Fair Value Gap (4H / FVG): The large gray shaded rectangle is labeled as a 4H / FVG (Fair Value Gap), also sometimes referred to as an Imbalance. This is an area where the market moved very quickly, leaving a price inefficiency (a gap between the high/low of specific candles). These gaps are often viewed as magnets that the price will return to in order to "fill" or "mitigate" the inefficiency before continuing its trend or reversing.
Bearish Scenario (The Setup):
The price has aggressively moved up and is currently near the lower boundary of the 4H / FVG.
The setup suggests a Contraction (CRT) phase. The high of this potential contraction is labeled CRT-L (Contraction Low, but likely indicating the upper boundary of the trade range).
The large green arrow shows the anticipated move: a reversal upon entering or touching the FVG/Supply Zone, leading to a move down to target the recent low of the strong rally (labeled CRT-H, indicating the high of the previous move/target low).
The target for the potential retracement is the area around the previous BOS level and the swing low that initiated the final push, around $4,120.00.
Interpretation: The chart suggests that the recent strong rally might be due for a deep retracement or even a short-term reversal, as the price is entering a potential supply/distribution zone created by the Fair Value Gap.
Conclusion
The chart presents a trade idea based on the mitigation of the 4H Fair Value Gap. A bearish entry is anticipated once the price fully enters the FVG, with the aim of capturing the move back down to the recent structure low (CRT-H). This is a common setup in SMC analysis, expecting the market to re-balance before the next major move.

📊 Professional Forex & Gold Analyst | Trading pure price action and high-probability market structure. Daily 4–5 quality trade setups with disciplined risk management. Join: t.me/+NJDp2aIM3QphYWNk| Contact: @fx_martin9
Exención de responsabilidad
La información y las publicaciones no constituyen, ni deben considerarse como, asesoramiento o recomendaciones financieras, de inversión, de trading u otro tipo, proporcionadas o respaldadas por TradingView. Obtenga más información en Condiciones de uso.
📊 Professional Forex & Gold Analyst | Trading pure price action and high-probability market structure. Daily 4–5 quality trade setups with disciplined risk management. Join: t.me/+NJDp2aIM3QphYWNk| Contact: @fx_martin9
Exención de responsabilidad
La información y las publicaciones no constituyen, ni deben considerarse como, asesoramiento o recomendaciones financieras, de inversión, de trading u otro tipo, proporcionadas o respaldadas por TradingView. Obtenga más información en Condiciones de uso.