
Hi Everyone.
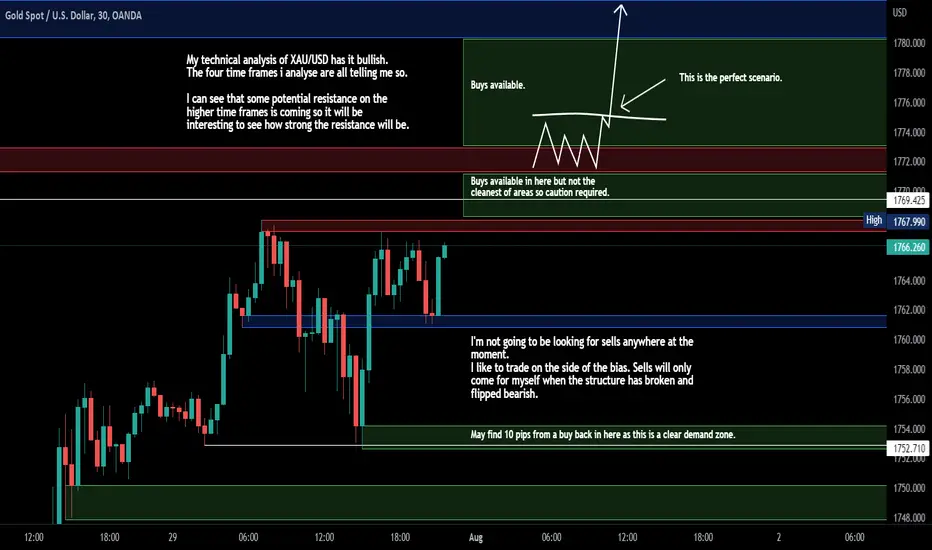
This is a 30 min chart created ready for Mondays trading session but is also set up so it can be used for the rest of the week. With changes that suit price action.
I started by finding the bias/trend of the weekly, daily, 4 hour and 1 hour time frames. This analysis showed me that gold is 4 v 0 in favour of the bulls.
I then used that information to mark up areas of Supply and Demand and also potentially upcoming resistance zones. As I am fully bullish I will only be looking for buys until the chart tells me otherwise.
I will re-analyse on Monday before I start trading.
Use the chart as you want. It is very basic but it works. I have learnt from Todd Capital Group so maybe watch some of his videos to learn more about the way i get my bias and mark the zones.
This is a 30 min chart created ready for Mondays trading session but is also set up so it can be used for the rest of the week. With changes that suit price action.
I started by finding the bias/trend of the weekly, daily, 4 hour and 1 hour time frames. This analysis showed me that gold is 4 v 0 in favour of the bulls.
I then used that information to mark up areas of Supply and Demand and also potentially upcoming resistance zones. As I am fully bullish I will only be looking for buys until the chart tells me otherwise.
I will re-analyse on Monday before I start trading.
Use the chart as you want. It is very basic but it works. I have learnt from Todd Capital Group so maybe watch some of his videos to learn more about the way i get my bias and mark the zones.

Exención de responsabilidad
La información y las publicaciones no constituyen, ni deben considerarse como, asesoramiento o recomendaciones financieras, de inversión, de trading u otro tipo, proporcionadas o respaldadas por TradingView. Obtenga más información en Condiciones de uso.
Exención de responsabilidad
La información y las publicaciones no constituyen, ni deben considerarse como, asesoramiento o recomendaciones financieras, de inversión, de trading u otro tipo, proporcionadas o respaldadas por TradingView. Obtenga más información en Condiciones de uso.