
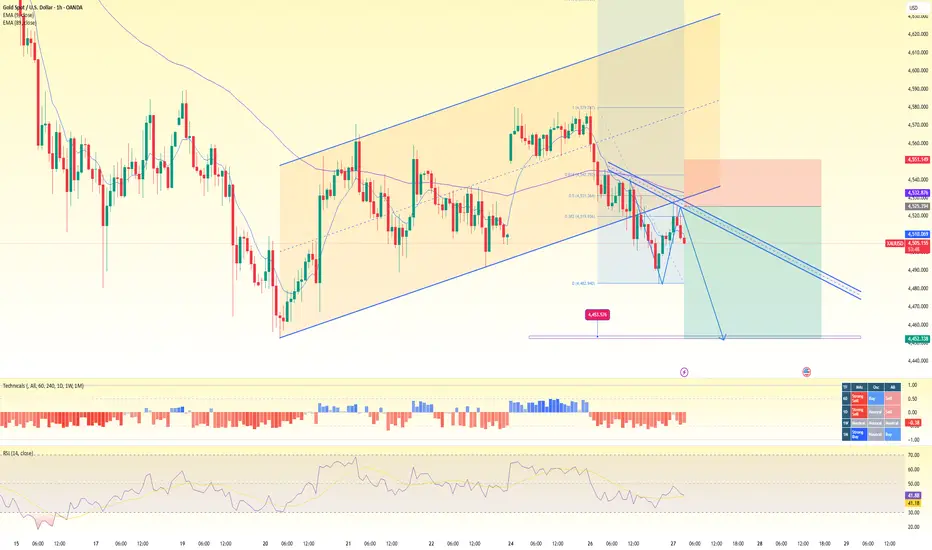
Continued sideways movement, downward correction below 4500
📈 1. Trend & Market Structure
Overview:
Gold remains in a medium-term downtrend, with the short-term EMA (~4.510) still below EMA89 (~4.533) → indicating the primary trend remains bearish.
Following the rally within an ascending channel, price has broken below the support trendline, signaling weakening recovery momentum.
Price is currently forming a short-term bearish channel after a strong rejection around the 4.57x–4.58x area.
The current structure shows Lower Highs + increasing selling pressure, suggesting sellers remain in control.
👉 Current trend:
Short-term bearish correction within a broader medium-term downtrend.
📊 2. Price Action & Momentum
Price Action:
Price was strongly rejected around 4.57x, then declined continuously and broke below previous ascending support.
Gold is currently fluctuating around 4.50x–4.51x, trading below EMA89 and below the 0.382–0.5 Fibonacci zone → indicating weakness.
A pullback-to-resistance followed by further decline pattern is emerging, aligning with a bearish continuation scenario.
The next downside target points toward the 4.45x–4.46x support zone.
Momentum:
RSI ~41 → weak momentum, though not yet in oversold territory.
The histogram remains red, indicating selling pressure still dominates.
No clear bullish reversal signals have appeared yet.
👉 Short-term scenarios:
✔️ If price reclaims 4.52x–4.53x
→ Recovery may extend toward 4.55x
❌ If price continues to face rejection below 4.52x
→ Risk of decline toward 4.47x → 4.45x
📌 3. Key Support & Resistance Levels
🔴 Near Resistance: 4.520 – 4.535
EMA89
Fib 0.5
Retest zone after breakdown
👉 Break above:
→ Potential recovery toward 4.55x
🔴 Strong Resistance: 4.550 – 4.570
Recent swing high
Strong supply zone
Area where sellers may re-enter
👉 Break above this zone:
→ Confirms a stronger recovery
🔵 Near Support: 4.490 – 4.480
Current pullback low
Fibonacci extension area
👉 Break below:
→ Opens downside toward 4.45x
🔵 Strong Support: 4.455 – 4.450
Major horizontal support
Next bearish target
👉 Loss of this zone:
→ Bearish continuation could accelerate further downside.
-------------------------
BUY GOLD zone : 4456 - 4453
SL: 4448
TP: 4470 - 4488 - 4505
------------------------
Overview:
Gold remains in a medium-term downtrend, with the short-term EMA (~4.510) still below EMA89 (~4.533) → indicating the primary trend remains bearish.
Following the rally within an ascending channel, price has broken below the support trendline, signaling weakening recovery momentum.
Price is currently forming a short-term bearish channel after a strong rejection around the 4.57x–4.58x area.
The current structure shows Lower Highs + increasing selling pressure, suggesting sellers remain in control.
👉 Current trend:
Short-term bearish correction within a broader medium-term downtrend.
📊 2. Price Action & Momentum
Price Action:
Price was strongly rejected around 4.57x, then declined continuously and broke below previous ascending support.
Gold is currently fluctuating around 4.50x–4.51x, trading below EMA89 and below the 0.382–0.5 Fibonacci zone → indicating weakness.
A pullback-to-resistance followed by further decline pattern is emerging, aligning with a bearish continuation scenario.
The next downside target points toward the 4.45x–4.46x support zone.
Momentum:
RSI ~41 → weak momentum, though not yet in oversold territory.
The histogram remains red, indicating selling pressure still dominates.
No clear bullish reversal signals have appeared yet.
👉 Short-term scenarios:
✔️ If price reclaims 4.52x–4.53x
→ Recovery may extend toward 4.55x
❌ If price continues to face rejection below 4.52x
→ Risk of decline toward 4.47x → 4.45x
📌 3. Key Support & Resistance Levels
🔴 Near Resistance: 4.520 – 4.535
EMA89
Fib 0.5
Retest zone after breakdown
👉 Break above:
→ Potential recovery toward 4.55x
🔴 Strong Resistance: 4.550 – 4.570
Recent swing high
Strong supply zone
Area where sellers may re-enter
👉 Break above this zone:
→ Confirms a stronger recovery
🔵 Near Support: 4.490 – 4.480
Current pullback low
Fibonacci extension area
👉 Break below:
→ Opens downside toward 4.45x
🔵 Strong Support: 4.455 – 4.450
Major horizontal support
Next bearish target
👉 Loss of this zone:
→ Bearish continuation could accelerate further downside.
-------------------------
BUY GOLD zone : 4456 - 4453
SL: 4448
TP: 4470 - 4488 - 4505
------------------------
Operación activa
Gold's downward trend continues, returning to support at 4480.
Operación cerrada: objetivo alcanzado
Exactly : trend decrease : HIT 4402 
MOON | Forex Academy hopes to bring the best experience to the Forex community
💠 Update the fastest news
💠 Trend analysis: XAU, BTC, Currency,...
💠My channel:
" t.me/+wmcIWR0hqD5mYjhl "
💠 Update the fastest news
💠 Trend analysis: XAU, BTC, Currency,...
💠My channel:
" t.me/+wmcIWR0hqD5mYjhl "
Publicaciones relacionadas
Exención de responsabilidad
La información y las publicaciones no constituyen, ni deben considerarse como, asesoramiento o recomendaciones financieras, de inversión, de trading u otro tipo, proporcionadas o respaldadas por TradingView. Obtenga más información en Condiciones de uso.
MOON | Forex Academy hopes to bring the best experience to the Forex community
💠 Update the fastest news
💠 Trend analysis: XAU, BTC, Currency,...
💠My channel:
" t.me/+wmcIWR0hqD5mYjhl "
💠 Update the fastest news
💠 Trend analysis: XAU, BTC, Currency,...
💠My channel:
" t.me/+wmcIWR0hqD5mYjhl "
Publicaciones relacionadas
Exención de responsabilidad
La información y las publicaciones no constituyen, ni deben considerarse como, asesoramiento o recomendaciones financieras, de inversión, de trading u otro tipo, proporcionadas o respaldadas por TradingView. Obtenga más información en Condiciones de uso.