
Peace Talks and Gold:What If the Market Does the Opposite Again?
Last week did not provide a definitive answer regarding Gold’s next major move.
In fact, if anything, it reminded us how dangerous it is to become overly confident in a market that is still searching for direction.
The week started with an upside gap, pushing Gold toward the 4580 area. Then the market reversed, broke below the important 4500 support on Wednesday, and eventually reached my previously discussed 4400 target.
The selling did not stop there.
The following day, Gold continued lower and printed a low around 4365, almost perfectly aligned with the October 2025 all-time high area.
And then came the surprise.
From that low, Gold produced a violent reversal of more than 2000 pips.
Naturally, the question everyone is asking now is:
Was that the beginning of a new bullish phase, or simply another violent reaction inside a broader bearish trend?
The Technical Picture Still Favors Bears
From my perspective, bulls are not out of the woods.
Not even close.
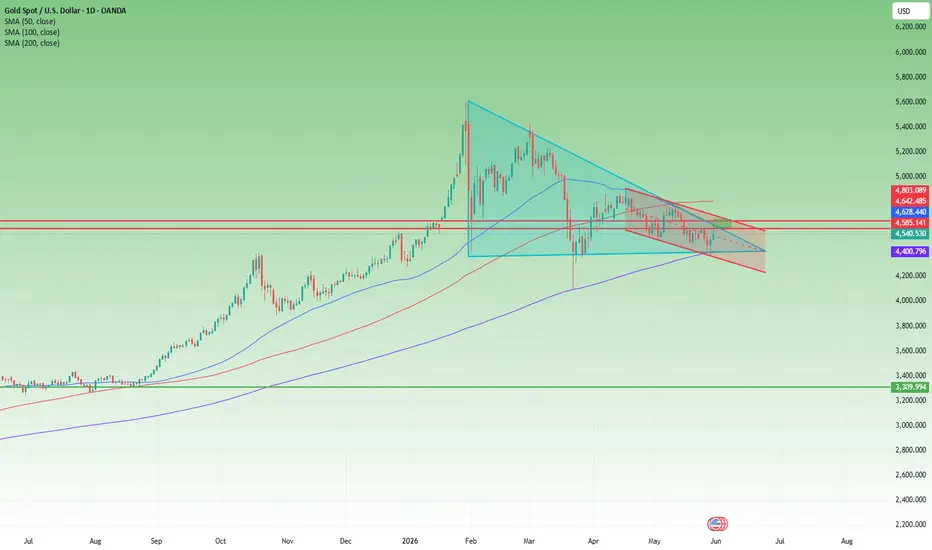
When we zoom out and look at the daily chart, the structure that started after the January all-time high remains intact.
We still have:
- a sequence of lower highs
- a descending triangle structure
- and, since the mid-April high, a descending channel
None of these structures have been invalidated.
Yes, the recent reversal was impressive.
But impressive moves and trend changes are not the same thing.
At the moment, Gold remains below both the 50 SMA and the 100 SMA.
And there is another detail that deserves attention:
For the first time in roughly three years, Gold is trading below the 100 SMA.
That is not a small observation.
Long-term moving averages do not change direction because of one emotional headline or one strong session. They reflect underlying market structure.
Even more concerning for bulls is the fact that the 50 SMA has already started turning lower and crossed below the 100 on May 8.
Now, to be clear, I do not build my analyses around moving averages.
But when price is below both the 50 and 100 SMA, and the shorter average starts pointing down, it is difficult to argue that the technical picture is healthy.
At least not yet.
The One Bullish Argument
To be objective, there is one element that bulls can point to.
The recent reversal happened almost exactly from the 200 SMA.
And historically, the 200 SMA often acts as a dividing line between long-term bullish and bearish environments.
So yes, the reaction from that level suggests that the larger bullish trend may not be completely dead.
But there is a huge difference between:
- a market finding support
- and a market becoming bullish again
At the moment, we only have the first.
Not the second.
The Psychology Behind the Headlines
Now let's talk about the part that interests me even more than the technicals.
The narrative.
Over the past two days, everyone seems focused on ceasefires, peace negotiations, war-ending headlines, and geopolitical developments.
And suddenly the dominant narrative became:
"War ending = Gold must rise."
But as always, I have questions.
Because markets rarely reward obvious thinking.
Let me remind you what happened at the beginning of March.
Back then, geopolitical tensions escalated dramatically.
The market narrative was simple:
"War = Gold must go up."
Gold opened with a gap on Monday, pushed above 5400, and everyone expected continuation.
Instead, the day closed red.
And what followed was even more remarkable.
Gold proceeded to collapse roughly 13,000 pips.

A move so aggressive that many traders were left speechless, unable to understand why the expected bullish catalyst had produced the exact opposite outcome.
Now the narrative changed.
Now the market says:
"Peace = Gold must go up."
But what if the outcome ends up being exactly the same?
What if the narrative changes but the market reaction does not?
Because one lesson the market taught me repeatedly over the years is this:
There is rarely such a thing as:
"We wait for the news, we buy, and we make easy money."
If it were that simple, everyone would be rich.
Markets are designed specifically to make the obvious trade difficult.
My Trading View
Going back to the chart, my opinion remains relatively straightforward.
As long as Gold remains below the 4630–4650 resistance zone, I continue to view the market as bearish.
Could a treaty, ceasefire, or major whatever geopolitical announcement trigger another spike higher?
Absolutely.
In today's environment, almost anything can trigger a temporary move.
But temporary spikes and structural trend changes are two very different things.
And until Gold proves otherwise by reclaiming and holding above that resistance area, I continue to believe that the broader downtrend will eventually prevail.
Because in trading, narratives come and go.
Structure tends to matter much longer 🚀
In fact, if anything, it reminded us how dangerous it is to become overly confident in a market that is still searching for direction.
The week started with an upside gap, pushing Gold toward the 4580 area. Then the market reversed, broke below the important 4500 support on Wednesday, and eventually reached my previously discussed 4400 target.
The selling did not stop there.
The following day, Gold continued lower and printed a low around 4365, almost perfectly aligned with the October 2025 all-time high area.
And then came the surprise.
From that low, Gold produced a violent reversal of more than 2000 pips.
Naturally, the question everyone is asking now is:
Was that the beginning of a new bullish phase, or simply another violent reaction inside a broader bearish trend?
The Technical Picture Still Favors Bears
From my perspective, bulls are not out of the woods.
Not even close.
When we zoom out and look at the daily chart, the structure that started after the January all-time high remains intact.
We still have:
- a sequence of lower highs
- a descending triangle structure
- and, since the mid-April high, a descending channel
None of these structures have been invalidated.
Yes, the recent reversal was impressive.
But impressive moves and trend changes are not the same thing.
At the moment, Gold remains below both the 50 SMA and the 100 SMA.
And there is another detail that deserves attention:
For the first time in roughly three years, Gold is trading below the 100 SMA.
That is not a small observation.
Long-term moving averages do not change direction because of one emotional headline or one strong session. They reflect underlying market structure.
Even more concerning for bulls is the fact that the 50 SMA has already started turning lower and crossed below the 100 on May 8.
Now, to be clear, I do not build my analyses around moving averages.
But when price is below both the 50 and 100 SMA, and the shorter average starts pointing down, it is difficult to argue that the technical picture is healthy.
At least not yet.
The One Bullish Argument
To be objective, there is one element that bulls can point to.
The recent reversal happened almost exactly from the 200 SMA.
And historically, the 200 SMA often acts as a dividing line between long-term bullish and bearish environments.
So yes, the reaction from that level suggests that the larger bullish trend may not be completely dead.
But there is a huge difference between:
- a market finding support
- and a market becoming bullish again
At the moment, we only have the first.
Not the second.
The Psychology Behind the Headlines
Now let's talk about the part that interests me even more than the technicals.
The narrative.
Over the past two days, everyone seems focused on ceasefires, peace negotiations, war-ending headlines, and geopolitical developments.
And suddenly the dominant narrative became:
"War ending = Gold must rise."
But as always, I have questions.
Because markets rarely reward obvious thinking.
Let me remind you what happened at the beginning of March.
Back then, geopolitical tensions escalated dramatically.
The market narrative was simple:
"War = Gold must go up."
Gold opened with a gap on Monday, pushed above 5400, and everyone expected continuation.
Instead, the day closed red.
And what followed was even more remarkable.
Gold proceeded to collapse roughly 13,000 pips.
A move so aggressive that many traders were left speechless, unable to understand why the expected bullish catalyst had produced the exact opposite outcome.
Now the narrative changed.
Now the market says:
"Peace = Gold must go up."
But what if the outcome ends up being exactly the same?
What if the narrative changes but the market reaction does not?
Because one lesson the market taught me repeatedly over the years is this:
There is rarely such a thing as:
"We wait for the news, we buy, and we make easy money."
If it were that simple, everyone would be rich.
Markets are designed specifically to make the obvious trade difficult.
My Trading View
Going back to the chart, my opinion remains relatively straightforward.
As long as Gold remains below the 4630–4650 resistance zone, I continue to view the market as bearish.
Could a treaty, ceasefire, or major whatever geopolitical announcement trigger another spike higher?
Absolutely.
In today's environment, almost anything can trigger a temporary move.
But temporary spikes and structural trend changes are two very different things.
And until Gold proves otherwise by reclaiming and holding above that resistance area, I continue to believe that the broader downtrend will eventually prevail.
Because in trading, narratives come and go.
Structure tends to matter much longer 🚀
Nota
And no, I don't believe I can predict the future. Not even close.That's exactly why I use stop losses and why I sometimes take losses.
When I'm wrong, I take the loss like a man and move on. I don't sit indefinitely in a losing trade simply because my ego needs to be right.
BUT, what often amazes me, though, is how quickly traders forget.
Just three months ago, the dominant narrative was:
"War = Gold must go up."
Many of the same people who were shouting back then that Gold could only rise during times of war are now shouting that Gold can only rise during times of peace.
So I'm a little confused 🙂
Maybe the lesson is that narratives change much faster than charts do.
And that is exactly why I prefer studying price action rather than headlines. 🚀

🎯 Want More Trading Ideas?
📈 Join the FREE Forex & Gold Channel
👉 t.me/intradaytradingsignals
💎 Join the FREE Crypto Channel
👉 t.me/FanCryptocurrency
📈 Join the FREE Forex & Gold Channel
👉 t.me/intradaytradingsignals
💎 Join the FREE Crypto Channel
👉 t.me/FanCryptocurrency
Publicaciones relacionadas
Exención de responsabilidad
La información y las publicaciones no constituyen, ni deben considerarse como, asesoramiento o recomendaciones financieras, de inversión, de trading u otro tipo, proporcionadas o respaldadas por TradingView. Obtenga más información en Condiciones de uso.
🎯 Want More Trading Ideas?
📈 Join the FREE Forex & Gold Channel
👉 t.me/intradaytradingsignals
💎 Join the FREE Crypto Channel
👉 t.me/FanCryptocurrency
📈 Join the FREE Forex & Gold Channel
👉 t.me/intradaytradingsignals
💎 Join the FREE Crypto Channel
👉 t.me/FanCryptocurrency
Publicaciones relacionadas
Exención de responsabilidad
La información y las publicaciones no constituyen, ni deben considerarse como, asesoramiento o recomendaciones financieras, de inversión, de trading u otro tipo, proporcionadas o respaldadas por TradingView. Obtenga más información en Condiciones de uso.